Article

Criteria for Optimal Site Selection for Ocean Thermal Energy Conversion (OTEC) Plants in Mexico

by
Erika Paola Garduño-Ruiz
1,*,
Rodolfo Silva
1,*,
Yandy Rodríguez-Cueto
1,
Alejandro García-Huante
1,
Jorge Olmedo-González
2,
M. Luisa Martínez
3,
Astrid Wojtarowski
4,
Raúl Martell-Dubois
5 and
Sergio Cerdeira-Estrada
5
1
Instituto de Ingeniería, Ciudad Universitaria, Circuito Exterior s/n, Coyoacán, 04510 Mexico City, Mexico
2
ESIQIE, Laboratorio Electroquímica, Instituto Politécnico Nacional, Avenida Instituto Politécnico Nacional s/n, Nueva Industrial Vallejo, 07738 Mexico City, Mexico
3
Functional Ecology Network, Instituto de Ecología, A.C. Xalapa, 91073 Veracruz, Mexico
4
El Colegio de Veracruz, Xalapa, 91000 Veracruz, Mexico
5
Comisión Nacional para el Conocimiento y Uso de la Biodiversidad (CONABIO), Tlalpan, 14010 Mexico City, Mexico
*
Authors to whom correspondence should be addressed.
Energies 2021, 14(8), 2121; https://doi.org/10.3390/en14082121
Submission received: 15 March 2021 / Revised: 4 April 2021 / Accepted: 6 April 2021 / Published: 10 April 2021
(This article belongs to the Special Issue Selected Papers from The 8th International OTEC Symposium)

Abstract

:
Sustainable energy is needed globally, and Ocean Thermal Energy Conversion (OTEC) is a possible way to diversify the energy matrix. This article suggests a preliminary selection process to find optimal sites for OTEC deployment on the Mexican coastline. The method comprises the (1) evaluation of the thermal power potential, using daily data (16 years) of sea surface temperature, and the percentage of available time of the power thresholds; (2) assessment of feasibility using a decision matrix, fed by technical, environmental and socioeconomic criteria; (3) identification of four potential sites; and (4) comparison of OTEC competitiveness with other technologies through the levelized cost of energy. Multi-criteria decision analysis was applied to select optimal sites, using the technique for ordering performance by the similarity to the ideal solution. The best sites were (1) Puerto Angel and (2) Cabo San Lucas; with power production of > 50 MW and a persistence of > 40%. As yet there is no evidence from operational OTEC plants that could alter the environmental and socioeconomic criteria weightings. More in situ studies on pilot plants should help to determine their possible environmental impact and socio-economic consequences before any larger-scale projects are implemented.

Graphical Abstract

1. Introduction

The potential of Marine Renewable Energy (MRE) is immeasurable, offering solutions for a sustainable energy transition that will drive diversification in the global energy matrix, strengthening the electricity sector and meeting current and projected demand. However, these technologies still face various research and development challenges if they are to become viable and competitive alternatives and allow governments to make regulations for their implementation.
Among the various MREs is the Thermal Gradient which, through Ocean Thermal Energy Conversion (OTEC) systems, takes advantage of the temperature differences (20 °C or greater) between the surface and deep water (~1000 m) of the ocean to generate electricity in a continuous and unlimited manner. This process is carried out through the thermodynamic Rankine cycle, which uses steam turbines to generate electricity. The OTEC efficiency is ~3%, but we would need less than 1% of this renewable energy to satisfy all our energy demand [1]. There are three main types of cycles: closed cycle (CC), which uses a working fluid with a low boiling point, which in its vapour phase drives the turbine; ammonia is the best working fluid for this. Despite its toxicity, the use of ammonia in industry is highly regulated through established codes, standards and practices [2]. Open cycle (OC), which uses seawater as fuel, whose vapor phase drives a turbine connected to a generator, produce valuable by-products; and hybrid (H), which combines open and closed cycles to produce electricity and drinking water [1,3].
OTEC by-products include desalinated water, Seawater Air Conditioning (SWAC) and Deep Ocean Water Applications (DOWA), such as aquaculture and cold agriculture (Cold Ag). OTEC plants are installed either onshore, at a near-shore distance, or are offshore floating plants, usually built on ships or platforms, a few kilometres off the coast [4].
Currently, there are only about 12 OTEC devices working worldwide, with a total capacity of 270 kW and an expected production of 2.17 GWh/year. However, the OTEC power potential is estimated to be 10,000–87,600 TWh/year [5,6] making it one of the most promising renewable technologies to cover the base load, besides offering economic and social incentives from the use of by-products. OTEC plants have been installed mainly in South Korea, Japan, the United States and France. In Japan, work is currently underway, with the private US company Makai Ocean Engineering Ltd., and Lockheed Martin, to develop the first 100 MW pilot plant [7] a milestone for commercial plants.
OTEC energy, like other MREs, is relatively costly compared to other Renewable Energies (RE) because the technology is still being developed. This affects the viability of future commercial-scale projects. The competitiveness of different power-generation technologies, LCOE, the Levelized Cost of Energy, is used. This is the cost per megawatt hour of the construction and operation phases of a power plant for all of its financial life [8]. Another key parameter used to compare generation technologies is the Capacity Factor (CF), which is the ratio between what a power generation plant is capable of generating at maximum energy output and its technical limitations over a period of time [9]. In the OTEC literature, there is an inversely proportional relationship between the LCOE and the nominal size of the plant. Thus, in the global electricity market, nominal sizes of over 50 MW would be the most promising and competitive [10]. Among the aspects to be taken into account for plant costs are generation capacity, by-products, cycle type and configuration, as well as those related to capital cost, operation, maintenance, repair, replacement and economic variables such as discount rate [3,11].
Parts of the coastline of the Mexican Exclusive Economic Zone (EEZ) have optimal characteristics for harvesting ocean Thermal Energy (TE). The bathymetry and temperature differences most suitable for OTEC plant deployment are found in the Mexican Pacific (MP) and the Caribbean Sea (CS) [12,13,14], as well as areas of tourist interest, which have power plants and electricity infrastructure nearby, and an increasing demand for electricity. These factors afford opportunities for the sustainable exploitation of the vast reservoirs of potential TE. Hernandez-Fontes et al., (2019) [12] detected that, over a five-year period analysis, the areas with highest OTEC potential are located in the southwest and southeast of Mexico, where there is a generation capacity of ~100–200 MW, and 70% operational persistence.
Despite the thermal potential verified for Mexican waters, social and environmental aspects are also of great relevance in determining the feasibility of installing power plants. Having the social acceptance of the new technologies and minimizing the impact on the environment are of highly relevant for a project’s viability, without these, the construction and operation phases can be slowed down or even stopped. Studies on such impacts and socioenvironmental aspects related to OTEC plants are generally lacking, and most relate only to prototype plants and do not realistically assess the impacts.
Of the MREs studies found in the specialized literature only 4.5% are related to OTEC and socio-environmental aspects. In these, the main interactions with the environment refer to environmental impacts based on hydrodynamics, geomorphology and chemistry [15]. These are generally related to the extraction of raw material for structural components, manufacturing devices, energy consumption and mooring foundations [16]. However, the most important aspect to consider is the deep-water discharge plume, because its physical-chemical composition can lead to the proliferation of harmful algae. In addition, it is important to bear in mind that physical and chemical alterations of the water column may have severe impacts in the plankton community and primary productivity [17]. Some researchers have suggested discharging the water below the euphotic zone to minimize the impacts of this processed water on the ocean, while others suggest using this water to produce by-products [2]. More in-depth studies are needed to determine the environmental impacts of OTEC, so that measures can be implemented to minimize these (and other) potentially harmful impacts.
One of the reasons OTEC is considered clean is that it lessens the carbon footprint in CO2 savings, compared to Fossil Fuel (FF) energy generation. Estimates by Paredes et al. [16] determined that the amount of CO2 emitted from an OTEC plant is 28.5–42.8 eq/kWh, considerably lower than the almost 900 eq/kWh from FF.
In social terms, RE, MREs and OTEC must all face the social perceptions surrounding the implementation of these projects, which has often been negative due to the failure of the developers to comply with environmental regulations, to encourage the involvement of the population, or to a lack of transparency [18]. Involving the population in the decision processes of installing a power plant is clearly of great importance for the success of the project. For example, a study in Cozumel found that the people´s perception towards RE was positive, but was negative to the installation of plants close to their property [18,19]. Elsewhere, well-known cases of social malpractice occurred in the Isthmus of Tehuantepec and Cozumel, where the local populations were completely opposed to the deployment of this type of RE, arguing losses to the natural environment and cultural heritage [18,20].
Within the political context of RE, Mexico has committed to a gradual reduction in dependence on FFs, through the fulfilment of various short- and medium-term targets. The SENER report [21] establishes that the targets for RE electricity generation are 35% by 2024, 37.7% by 2030 and 50% by 2050. Internationally, Mexico has also committed to the UN Sustainable Development Goals (SDGs). The country’s progress and participation in RE issues contribute towards achieving SDG 7, “affordable and clean energy” [22]. As can be seen in the wording of this goal, since “affordable” is used, one of the great challenges of MRE, in this case particularly OTECs, is the high cost of installation and production.
However, it should be noted that while the economic costs of FFs are lower than those of marine energies, FF costs do not include those associated with environmental degradation, which in the long term will have negative impacts on the socio-economic sphere, and other areas, due to the effects of climate change will have [23].
In terms of the electrical grid in Mexico, power is conducted via the National Electricity Grid (SEN in Spanish), of which the Interconnected National Grid (SIN in Spanish) is one of the country’s largest [24]. Part of this infrastructure has reached the end of its useful life and needs to be upgraded, and there are more than 2 million homes without electricity. Electricity consumption in Mexico has increased in recent years, in 2016 it was 9140 PJ and in 2018 it was 9236 PJ with demand projected growth rate of 3.2% by the year 2032 [25]. The greatest consumer of national electricity is the industry sector (~60%), followed by the residential sector (~23%) [25]. Thus, REs is now seen as an opportunity to meet these challenges.
The cost of energy is calculated through the operation of the electricity market, at specific locations and times, and is known as the Locational Marginal Price (LMP). This provides a base of the cost of serving the next MW at a specific location [26].
The objectives of the present work were: (1) to assess thermal potential along the Mexican coasts by means of daily Sea Surface Temperature (SST) satellite data over 16 years (2002–2018) at 1 km spatial resolution; (2) to estimate the amount of time that a 20 °C difference (thermal potential) is exceeded, from 2002 to 2018, and for specific thresholds, to know the persistence, given as a percentage of the power availability for the OTEC system; (3) to select optimal sites for OTEC deployment on the MP and CS, where technical, environmental, and social aspects are evaluated, and (4) to compare the competitiveness of OTEC and other means of power generation, via the LCOE.
It is hoped that this exercise will serve to show alternatives that could diversify the National Energy Matrix (NEM), strengthen the energy sector and meet national demands for electricity, both current and projected.

2. Materials and Methods
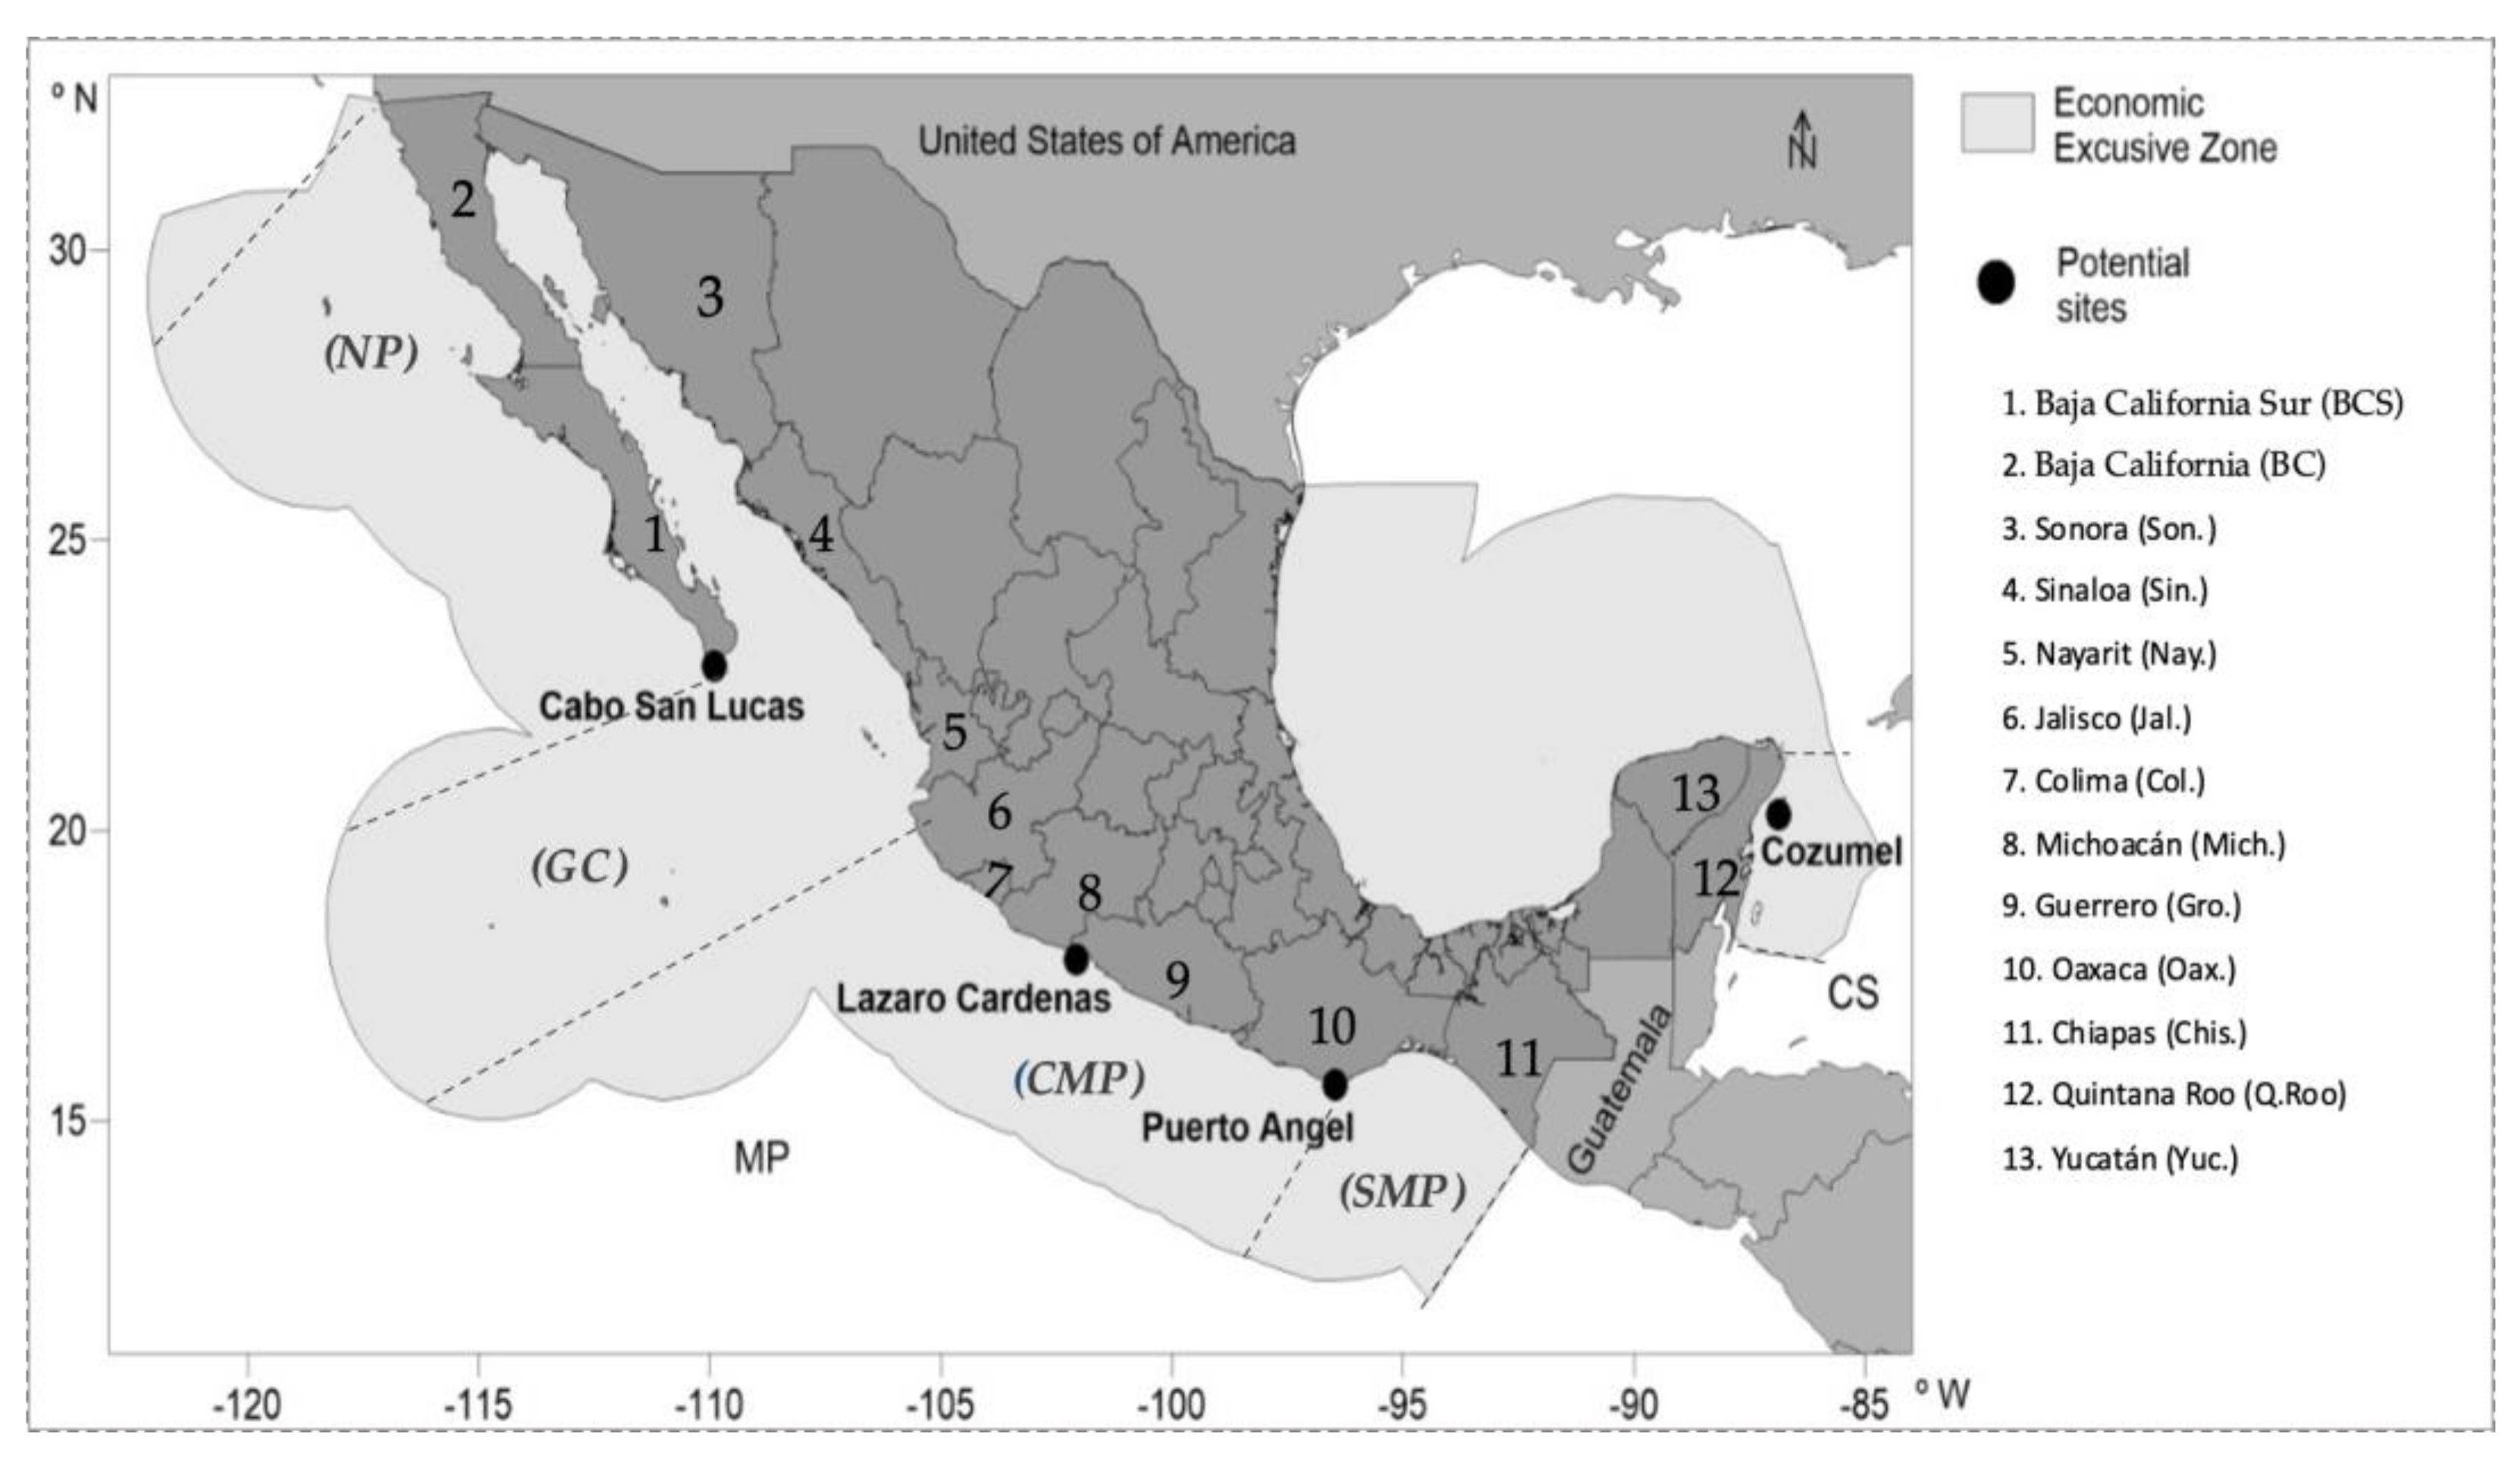
The study was divided into 4 sections, which describe the processes used to determine the optimal sites for OTEC deployment, including methods to compare criteria and the descriptions of the potential sites. In the last section, the competitiveness of OTEC and other electricity generation technologies are compared, using the LCOE. The methodology involved time series analysis, spatial distribution by Geographic Information System (GIS), Multi-Criteria Decision Analysis (MCDA) using the Technique for Order Performance by Similarity to Ideal Solution (TOPSIS).

2.1. Study Area

The study area is limited to the Exclusive Economic Zone of the Mexican Pacific (MP) and Caribbean Sea (CS) as shown in Figure 1. The Gulf of Mexico was excluded because its continental shelf is among the widest of the country and the 1000 m isobath is over 30 km away from the coastline. In the west of the MP, the study area includes the northern part of the Eastern Tropical Pacific (ETP), which is influenced by the El Niño-Southern Oscillation (ENSO), and is characterised by shallow waters in the coastal zone, from 14° N to 32° N. The MP is divided into four regions (see Table 1) because of its different dynamics and complex behaviour: 1. Northwestern Pacific (NP), 2. Gulf of California (GC), 3. the Central MP region (CMP) and 4. the Southern MP region (SMP) [27].
On the other hand, the CS is off the state of Quintana Roo, where there are three main islands near the continental shelf: Cozumel, Mujeres, and Contoy [32]. A small basin, it has a semi-enclosed sea, roughly aligned North–South, within the latitudes 18°11′ and 21°36′ N, which funnels water masses and heat from the Atlantic Ocean into the Gulf of Mexico [32]. The topography of the CS includes two channels parallel to the coast (1) Cozumel channel, which is ~400 m deep and 18 km wide, and (2) the other is located to the east of Cozumel Island, ~1000 m deep. To the east of both channels the Yucatan Channel is formed, which has velocities of over 0.6 ms−1 and a width of approximately 50–100 km [33]. Yucatan Channel is the only connection between the CS and the Gulf of Mexico. The surface water of the CS has a mean temperature above 27 °C and 7.7 °C at 700 m depth [34].

2.2. Bathymetry

The bathymetry for all the coastal zones was estimated from the General Bathymetric Chart of the Oceans (GEBCO) [35]. From this, the best locations for potential TE harvesting were identified, based on a global terrain model for the ocean and land at 15 arc-second intervals.

2.3. Deep Ocean Temperature (Td)

The Deep Ocean Temperature, (Td) at 1000 m depth, was taken from the monthly statistical mean (1955–2012) of the World Ocean Atlas (WOA) [36]. This has a spatial resolution of 0.25 × 0.25 degrees and is a product of the Ocean Climate Laboratory of the National Oceanographic Data Centre (U.S.), maintained by the World Ocean Database (WOD).
The vertical temperature distribution decreases exponentially with increasing water depth. The presence of the thermocline depends on the geographical position and factors such as precipitation and river discharges, among others. At depths below 1000 m, temperatures are <5 °C [37]. From the monthly deep sea temperature data at 1000 m (Td), the annual average was obtained with its standard deviation. The spatial resolution was resampled to 0.01 × 0.01 degrees, in order to standardise it and compare it with the SST values.

2.4. Sea Surface Temperature (SST)

The SST was acquired from the Oceanic Monitoring Satellite System (SATMO, in Spanish) which is part of the Coastal Marine Information and Analysis System (SIMAR, in Spanish). SATMO has daily data (1 June 2002–24 August 2018) and 0.01 × 0.01 degrees of spatial resolution. These data offer a new, automatic, near real-time operational processing system introduced for continuous monitoring of SST. The SST values of the SATMO are derived from two sources OSTIA and GHRSST-MUR by optimal multiscale interpolation and the data are filtered (based on surface wind speed data) to remove diurnal variability [38,39].
Daily mean SSTs were extracted from the SATMO time series from a polygon covering the coastline to 15 km from the EEZ, to reduce submarine cable costs and transmission losses.
SST d =   ι = 1 16 SST d ι   16
where, SST d is the surface temperature corresponding to each day of the year, 𝑑 equals the days of the year (1 ≤ 𝑑 ≤ 365 (366 for leap years)) and SST d corresponds to the surface temperature of each day of the year for each year of the time series between 2002 and 2018 (1 ≤ 𝑖 ≤ 16).

2.5. Sea Water Temperature Difference between the Surface and the Depth of 1000 ( T m )

The T m was obtained from the difference between the SST and Td data, obtaining 365 (366 for leap years) values for each of the points in the database.
T m =   S S T d T d

2.6. OTEC Net Power ( P n e t )

Considering information on temperature differences, water flow and pump power, the theoretical calculation of the net power Pnet was evaluated employing the equations proposed by Nihous [40].
P n e t = Q c w 3 ρ C p   ε t g γ 16   1 + γ   T m 2 T P p u m p
P p u m p = Q c w 0.30 ρ C p   ε t g γ 4   1 + γ
where the Q c w (m3/s) is the volume flow rate of the deep seawater intake at 1000 m depth (for 50 MW, Q c w = 138.6 m3/s (Vega [10]). In personal communication with Nihous, he suggested considering 50 MW as a pre-design value. is the ratio between the hot and cold water flows, considered equal to 1.5; T m is the temperature difference (°C) between water at the surface and at a depth of 1000 m; T is the absolute temperature of the surface seawater, in Kelvin;   ρ     is the average density of seawater (1025 kg/m3); c p is the specific enthalpy of seawater (0.004 MJ/kgK) and ε t g is the efficiency of the turbogenerator (0.75). The pumping power defined in Equation (4) corresponds to 30% of the gross power of the first term on the right-hand side of the Equation (3), considering ideal conditions ( T m = 20 °C and T= 300 °K).

2.7. Persistencies (p) of the P n e t

The reliability of any energy producing plant is estimated from its operability or persistence (p). In this work, p is the percentage of the time series where the power generated is equal to, or greater than, the determined thresholds and is given as the percentage of days for which the available p net is within the following power thresholds (a) 0.00–9.90 MW; (b) 10.00–12.49 MW; (c) 12.50–24.90 MW; (d) 25.00–49.90 MW; and (e) ≥ 50.00 MW. These thresholds reflect the number of power modules that are needed to generate roughly 50 MW.
This number depends on the power that exists in a given region. In regions with a ≥ 50.00 MW capacity, a minimum of one module can be built. Where the capacity is 25–49.90 MW, a minimum of two modules can be built; with 12.50–24.90 MW, a minimum of 3 modules can be built; and capacities of 10.00–12.49, a minimum of 5 modules can be built; if the capacity is 0.00–9.90 MW, a minimum of 6 modules can be built. A 50 MW plant may require 4 modules of 16 MW [10].

2.8. Decision Matrix (DM)

The DM was fed with various comparative criteria, including technical data (described above), environmental and socioeconomic aspects (Figure 2) and the specific particularities of each of the sites. The technical data includes (a) distance to cold-water intake at 1000 m depth, (b) temperature differences, (c) power availability, (d) extreme events, and (e) distance to the electricity grid. The environmental criteria are detections of protected areas. The socioeconomic criteria are (a) marginalization index, which describes the marginalization of communities, (b) homes without electricity and (d) local marginal pricing (USD/MWh). These data are described in Section 2.12, and the results are shown in Section 3.1, Section 3.2, Section 3.3, Section 3.4 and Section 3.5 and Appendix A in Table A1.

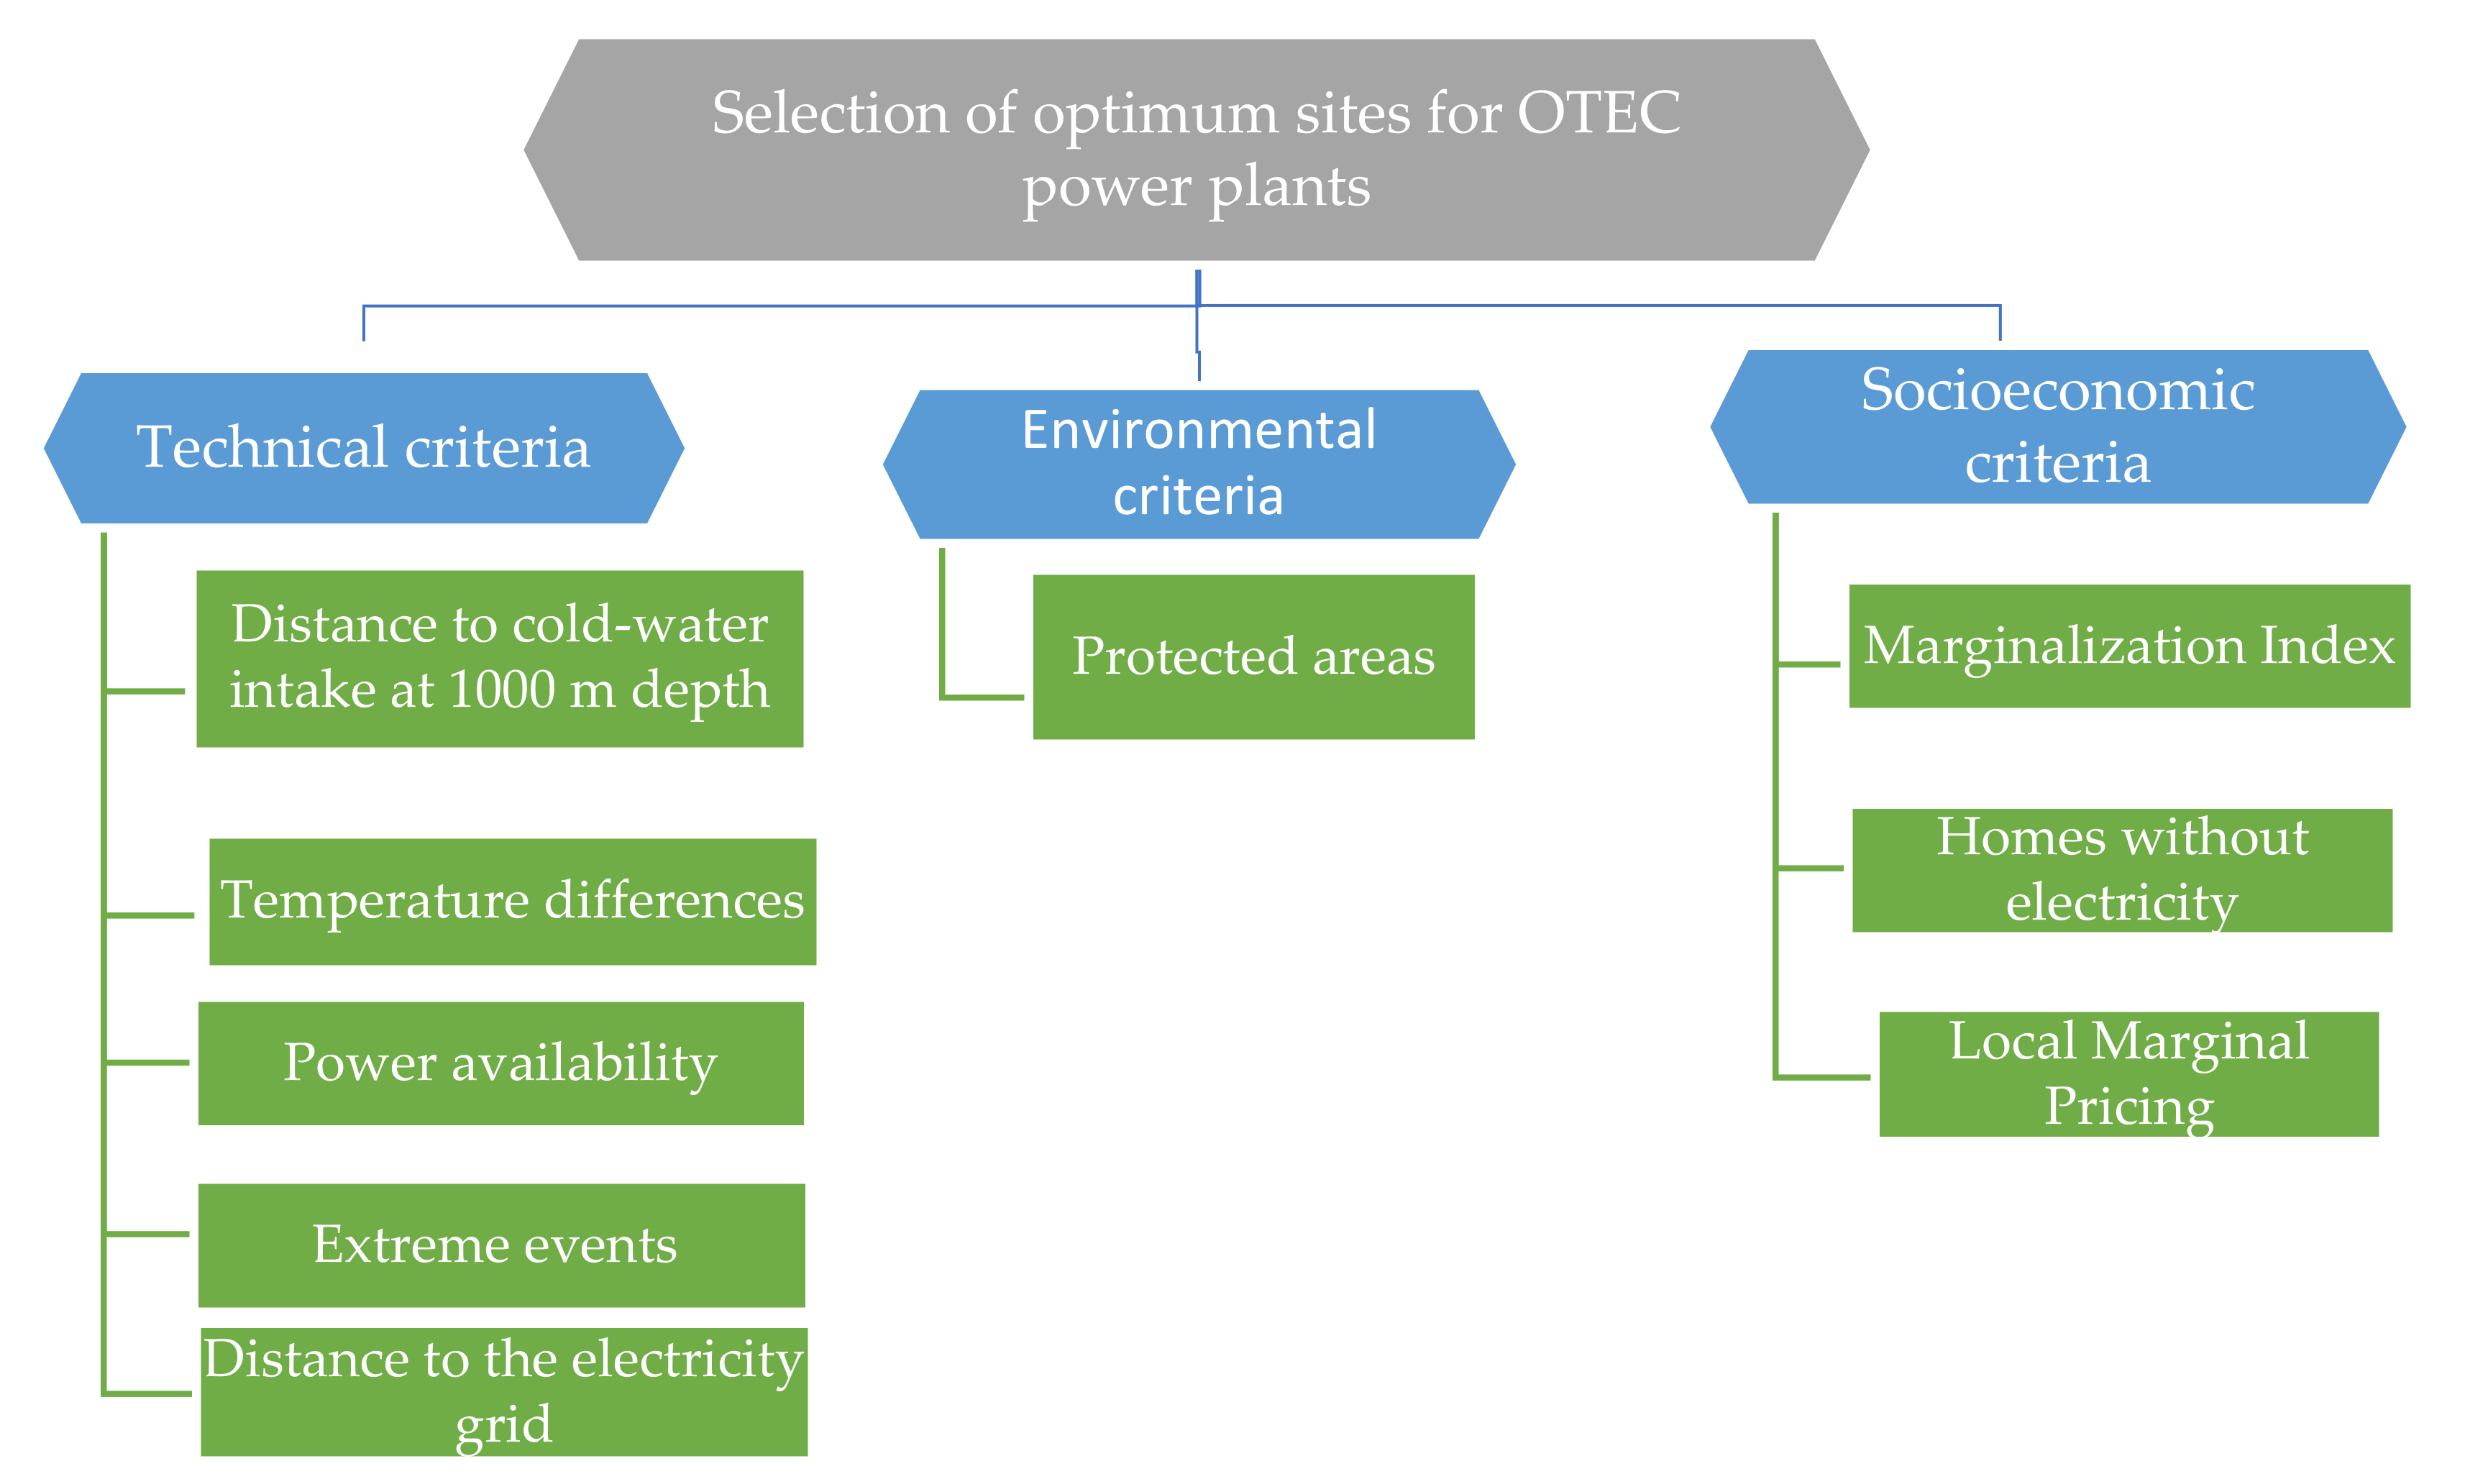
2.9. Comparative Criteria

The criteria used for comparison includes an assessment of data from semi-quantitative, semi-qualitative values, and a review of the literature, as well as official public information.

2.10. Technical Criteria

As mentioned earlier, one of the important criteria for deciding on the feasibility of a site for a TE plant is the distance to the cold-water intake, ideal sites are ≤ 15 km from the site. However, in the present work, the city of Lazaro Cardenas is included even though the cold-water intake is more than 15 km away. This is because the TE and Pnet have very high values and the tourist and industrial activities are very important nationally.
Similarly, according to the literature, it is best to select sites at T m > 20 °C for higher system efficiency. There are exceptions to this recommendation, such as the 20 kW OTEC pilot plant, developed by Korea Research Institute of Ships & Ocean engineering (KRISO), operating in South Korea at a temperature of T m ~18 °C.
Within the thermal potential persistence, a threshold of ≥ 50 MW was chosen, because the main evaluation of the work is based on a 50 MW plant, meaning that areas with the potential for a plant of this capacity can be considered for this study. Another important aspect is the extreme events that may influence the operation of the plant. In this case, the risk of Tropical Cyclones (TC) in coastal municipalities is presented, as these would be the main threat to an OTEC plant in Mexico, given the probability that many will turn into hurricanes. Of the average number of TCs formed, roughly 70% turn into hurricanes [41]. The degree of risk per TC was taken from the CENAPRED database [42], with risk classified as very high (5), high (4), medium (3), low (2) and very low (1).
Another important aspect is the existing electrical infrastructure. The distance to the electrical grid and to consumption centres is particularly important. This was measured in a straight line from the floating site proposed, to the nearest electrical node, where it may be easier to install new nodes, if required. The approximate location of the electrical nodes was defined from information found in the literature, as there was no access to their exact position [43,44].
The Local Marginal Pricing (LMP) and analysis of the congestion at the electrical nodes are important factors in identifying the market feasibility of installing power plants.
To assess electricity needs, the national consumption of electricity for 5 years (2013–2018) was analysed by sector (Figure 3). The industrial and residential sectors had the highest share of the consumption.
At site level the information about the residential sector is more reliable than that of the industrial sector, for this reason an estimation was made to obtain the Local Residential Electricity Consumption (LREC) for each site using Equation (5). The methodology determines the LREC indirectly, from the number of Homes with Electricity at National Level (HEN) [45], the National Residential Electricity Consumption (NREC) [39], the number of Homes with Electricity at the Local level (HEL) [25]. The Marginalization Index (MI) is used as a discriminant to allow differentiation between basic housing services [46], as explained in the following section.
LREC   MWh /   yr   = NREC   MWh yr HEN   homes × HEL   homes ×   MI

2.11. Environmental and Socio-Economic Criteria

Four databases were used to describe the environmental and socioeconomic criteria. For the former, the presence of Natural Protected Areas (NPAs), taken from the CONANP database [47], was important in determining the suitability, or otherwise, of sites, based on the importance of the ecosystems there, due to their high biodiversity and the legislative frameworks associated with them.
Socioeconomic criteria include the Marginalization Index from the CONAPO database [48], which describes the marginalization of communities as: very high (5), high (4), medium (3), low (2) and very low (1). The percentage of households without access to electricity, taken from the SEDESOL database [49], generally indicates areas with low social welfare [20]. The LMP which shows the cost of energy at a particular node and time, was taken from CENACE [45] using an annual average for 2019. All of the above information was integrated in GIS to obtain its spatial distribution.

2.12. Sites Chosen for Comparative Analysis

According to previous studies by García-Huante et al. [13] and Hernández-Fontes et al. [12], there are some promising areas in the study area which have optimal characteristics for OTEC deployment, based on their thermal potential, temperature differences, and distance to the cold-water intake. In this study, the feasibility of four sites in the study area for the deployment and a successful life cycle of an OTEC plant were analyzed to choose the optimal sites by MCDA. The four sites were selected using the characteristics mentioned below.
The sites were evaluated using bathymetric analysis; those located less than 15 km from the cold-water intake, with the exception of Lazaro Cardenas, as mentioned earlier. This distance is similar to those reported in the specialized literature, as the greater this distance, the higher the cost of the cabling and the lower its efficiency [50,51]. The sites with excellent thermal resources and adequate distances, are economically feasible options for OTEC plants.
The four sites selected for the comparative analysis are:
Cozumel. The island of Cozumel, Quintana Roo, is a typical Caribbean island with high tourist activity that produces a need for electricity in a grid already congested, and where the cost of electricity is one of the highest in Mexico [44]. Power is supplied to Cozumel via an underwater connection from a substation in Playa del Carmen. The island has a surface area of 647 km2 and predominately sandy shores [52]. On the CS coast there is excellent thermal potential throughout the year, making it an attractive site for OTEC development.
Lazaro Cardenas. The port of Lazaro Cardenas lies on the border of the states of Michoacan and Guerrero. It has an area of 1160 km2 [20] and is a port of great industrial interest, with 18% of the total commercial trade of Mexico, a key port between Asia and North America [53]. An important thermoelectric power station, Petacalco, is close to this site, with a capacity of 2778 MW [54].
Cabo San Lucas. In the municipality of Los Cabos, in the state of Baja California Sur (BCS), this site has an area of 3648 km2 [55], with a sandy coastline and rocky cliffs [56]. It was chosen as a potential site due to its great tourist interest, as an example of an area with a seasonal variation of thermal potential throughout the year. It is vulnerable to hurricane impact. A supply of drinking water and electricity are needed. The area has one of the highest energy costs in the country. For many years, BCS has not been connected to the SIN, however, one of the most important thermal power plants is in the area, Punta Prieta, generating 616 GWh. This power plant is connected to Los Cabos via several electrical nodes [43], including Cabo San Lucas Dos, the closest to the site.
Puerto Angel. The site is in the municipality of San Pedro Pochutla, in the state of Oaxaca. It has an area of 73 km2, and a sandy to rocky coastline [57]. From the technical and environmental perspectives, the site is feasible, as it has excellent year-round TE potential, and is close to the cold-water intake. Socioeconomically, there is significant social backwardness, as well as limited industrial activity. Nearby there are important wind power plants, such as Oaxaca I-IV and La Venta III, with a capacity of 613 MW, connecting the site to the Pochutla node by power cables.

2.13. Optimum Sites

Identifying optimum sites for OTEC deployment is of utmost importance for long-term success. This type of analysis is usually a spatial decision, using GIS and MCDA. GIS was used to measure the distances from the sites chosen to the 1000 m isobath, and to calculate the distances from the sites to the approximate position of the SEN connection nodes, as these calculations are computerised. Likewise, they were used for the elaboration of the maps showing the information analysed in this work. The MCDA tool was employed to rank the sites selected, using the criteria described earlier and by means of the Python library, Scikit-Criteria [58]. To solve complex decision-making problems, such as choosing the best option among several alternatives, MCDAs are often used [59,60].
The procedure in this work consisted of feeding a DM with a set of alternatives and criteria, and then assigning levels of importance, or weightings, to each criterion. The best MCDA tool was selected to solve the problem by means of a Python algorithm, thus obtaining the best option (Figure 4). The tools compare the relationship between the criteria and their weights. To reduce the subjectivity of assigning weights to each criterion, the Analytic Hierarchy Process (AHP) technique was applied using the Saaty method [61], while TOPSIS was applied to order the selected sites, following Roy and Słowiński [60].
TOPSIS was developed by Hwang and Yoon (1981) and is based on the concept that the best alternative is that which minimises the distance to the ideal positive solution, while maximising the distance to the ideal negative solution [62]. The positive-ideal solution is composed of all the best possible values of criteria, and the negative-ideal solution consists of all the worst possible values of the criteria [63].
Assuming that Ai (i = 1,…, m) is a set of alternatives and that Cj (j = 1,…, n) is a set of criteria denoted by xij, the method consists of the following steps [62].
Step 1. Determination of the DM
DM = x i j m   ×   n where   x ij   .
Step 2. Calculation of the normalised decision matrix R using vector normalisation
R = r i j m   ×   n
Where   r i j = x i j k = 1 m x k j 2 ,   i   =   1 , , m ;   j   =   1 , ,   n .
Step 3. Calculation of the weighted normalised matrix V by multiplying the columns of the normalised decision matrix R by the associated weights, satisfying wj .
w = (w1, w2,…, wn)
j = 1 n w j = 1
V = v i j m   ×   n
where   v i j   =   r i j · w i j
Step 4. Determination of the positive ideal solution A+ and determination of the negative ideal solution A
A +   =   v 1 + , v 2 + , , v n + = m a x   v i j |   j   B , m i n   v i j |   j   C
A   =   v 1 , v 2 , , v n = m i n   v i j |   j   B , m a x   v i j |   j   C
where
B   =   j   =   1 , , n |   j   associated   with   the   criteria   having   a   positive   impact
C   =   j   =   1 , , n |   j   associated   with   the   criteria   having   a   negative   impact
Step 5. Calculation of the Euclidean distances of each alternative Ai from the positive ideal solution A+ and the negative ideal solution A.
d i + = j = 1 n v i j v j + 2
d i = j = 1 n v i j v j 2
Step 6. Calculation of the relative closeness of each alternative Ai to the positive ideal solution A+, where the best alternative will be the one with the highest RCi value.
R C i = d i d i +   +   d i  

2.14. Levelised Cost of Energy (LCOE)

In order to understand and compare the future performance and competitiveness of OTECs in the electricity market with respect to different power generation technologies, a literature review of LCOE and CF was carried out for 2009–2010. It should be considered, some economic conditions (inflation and discount rate) between OTEC and the other plants are different.

3. Results and Discussion

From the analysis of Td, from the WOA database, it was determined that in the study area, at 1000 m, the annual average temperature is 5 °C, since its standard deviation was low (0.019–0.230 °C). With these results and the SST data from the SATMO database, the differences of temperature were incorporated into the Nihous equation (Equation (3)) to determine the theoretical net power (Pnet).
The sites with potential for the installation of floating OTEC plants are shown below, based on the criteria and alternatives that feed the DM. The MCDA analysis identifies the best sites, which compare OTEC to other types of power plants.

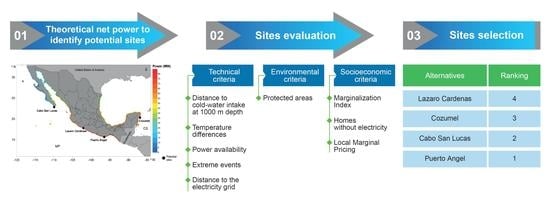
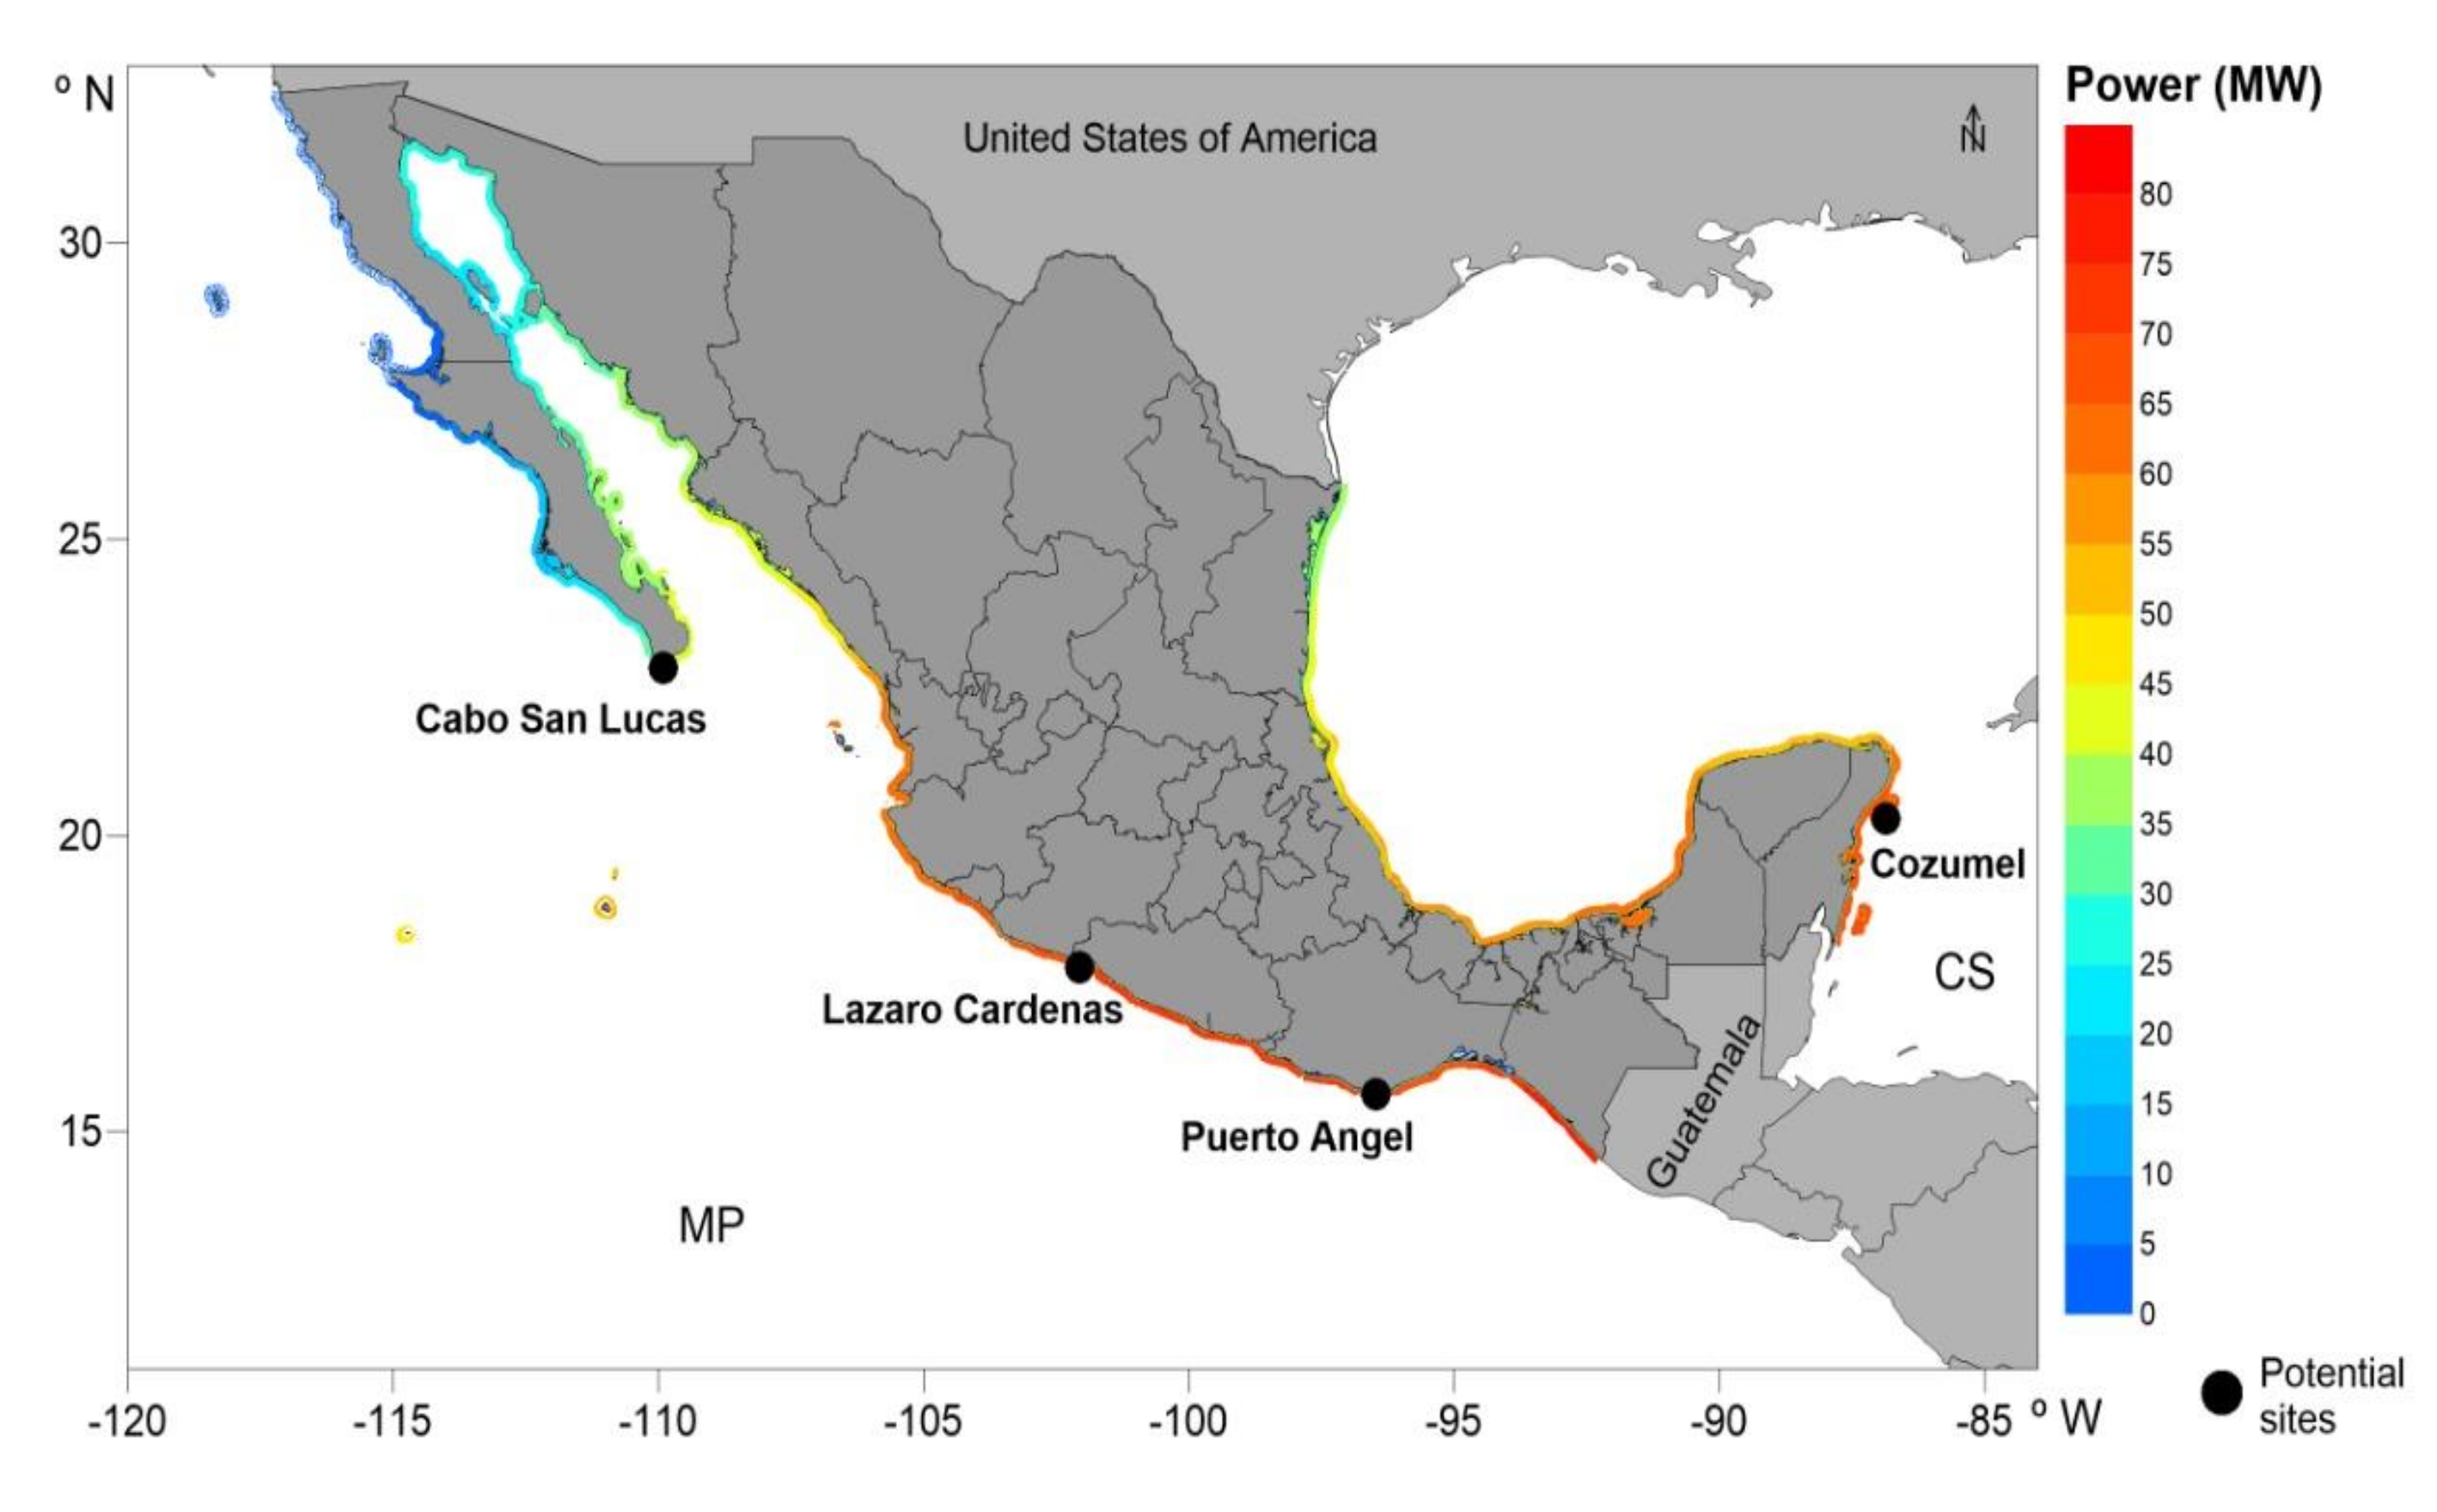
3.1. Selection of Potential Sites

The four sites selected were compared, based on the characteristics described in Section 2.12, and some technical characteristics, such as energy cost in the area (LMP), thermal power and extreme events, with the level of importance given as high (H), medium (M), and low (L), and shown from dark to light grey (Table 2).

3.2. Comparative Criteria

The assessment of the technical, environmental and socioeconomic aspects used the comparative criteria is described below.

3.3. Technical Criteria

These criteria involved: (1) site locations (locality and floating plants); (2) distances in km to the cold-water intake (~1000 m); (3) temperature differences between the sea-surface and 1000 m depth ( T m   ) ; (4) the power availability as an annual average of the Pnet values and percentage of availability over the time series; (5) extreme events and (6) distances from the floating plant to the electricity grid. In Table 3, the values for the criteria 1 to 3 are shown.
The shortest distance to the cold-water intake is at Puerto Angel, while the longest is at Lazaro Cardenas, where the depth isobath is over 20 km away. The T m   is suitable at all the sites, being greater than 20 °C.
The annual average of Pnet estimation (over 16 years), for potential OTEC-50MW-CC floating plants are shown in Figure 5. The Pnet values range from 0 to 80 MW with blue to red showing the potential power, from least to most. The average daily percentage of power availability of the OTEC system, p, over the time series at the sites analysed are shown in Table 4. The p values are based on thresholds for the modulus quantities that can be used to achieve a certain power (a) < 10.00 MW; (b) 10.00–12.49 MW; (c) 12.50–24.90 MW; (d) 25.00–49.90 MW and (e) ≥ 50.00 MW.
From the results, the Cabo San Lucas site is shown to have an average power of 38.66 MW with 42% operability for powers ≥ 50 MW. It is the only site with a persistency of less than 100% for this power threshold.
In the MP sites at Lazaro Cardenas and Puerto Angel have the highest thermal power values with 70.19 MW and 71.12 MW, respectively, and persistence of 100%. Finally, in the CS, Cozumel has an average power of 65.87 MW, with energy availability of ≥ 50 MW 100% of the year.
For all the sites, the cold-water intake (1000 m depth) is close to the coast, except for Lazaro Cardenas. Overall, the results suggest that the best sites in Mexico to extract thermal gradient energy are Puerto Angel, Cozumel and Cabo San Lucas.

Extreme Events

The level of risk associated with the formation of Tropical Cyclones (TC) in coastal municipalities of Mexico (Figure 6) was analysed in order to assess the potential risk to the performance of a floating OTEC plant. The TC risk is classified from “very low (green)” to “very high (red)”. From the results it is seen that the site with lowest risk is Puerto Angel. However, all sites need a TC risk management plan so that the operation of the plant is not unduly affected in the event of this type of extreme events.

Distance from the Main Electric Grid

The distance to the electricity grid, the average energy production and the percentage of electricity consumption supplied by the four OTEC sites are shown in Table 5. The proximity of the plants to the interconnection node is considered as very relevant in the multi-criteria analysis. It is also suggested that the CENACE management plan, concerning protocols for permissions and evaluations should be reviewed, to contemplate the feasibility of future connections.
The energy production estimates show that the sites with greatest potential are Cozumel, Lazaro Cardenas and Puerto Angel. The latter could supply up to 16% of the energy consumed in the state of Oaxaca. On the other hand, Cabo San Lucas has the shortest distance to the grid interconnection. With a production of 105.95 GWh/year, an OTEC plant here could satisfy 2% of the energy demand in the state of BCS. The site at Lazaro Cardenas is unusual in that the 1000 m isobath is over 20 km from the coast but it is an important site because one of the largest thermal power plants in the country is nearby, and the substantial hot water effluent ≈40 °C [64] from it could be used to generate thermal gradient energy by means of a variant of OTEC called Coastal Thermal Gradient Energy (CTEC).

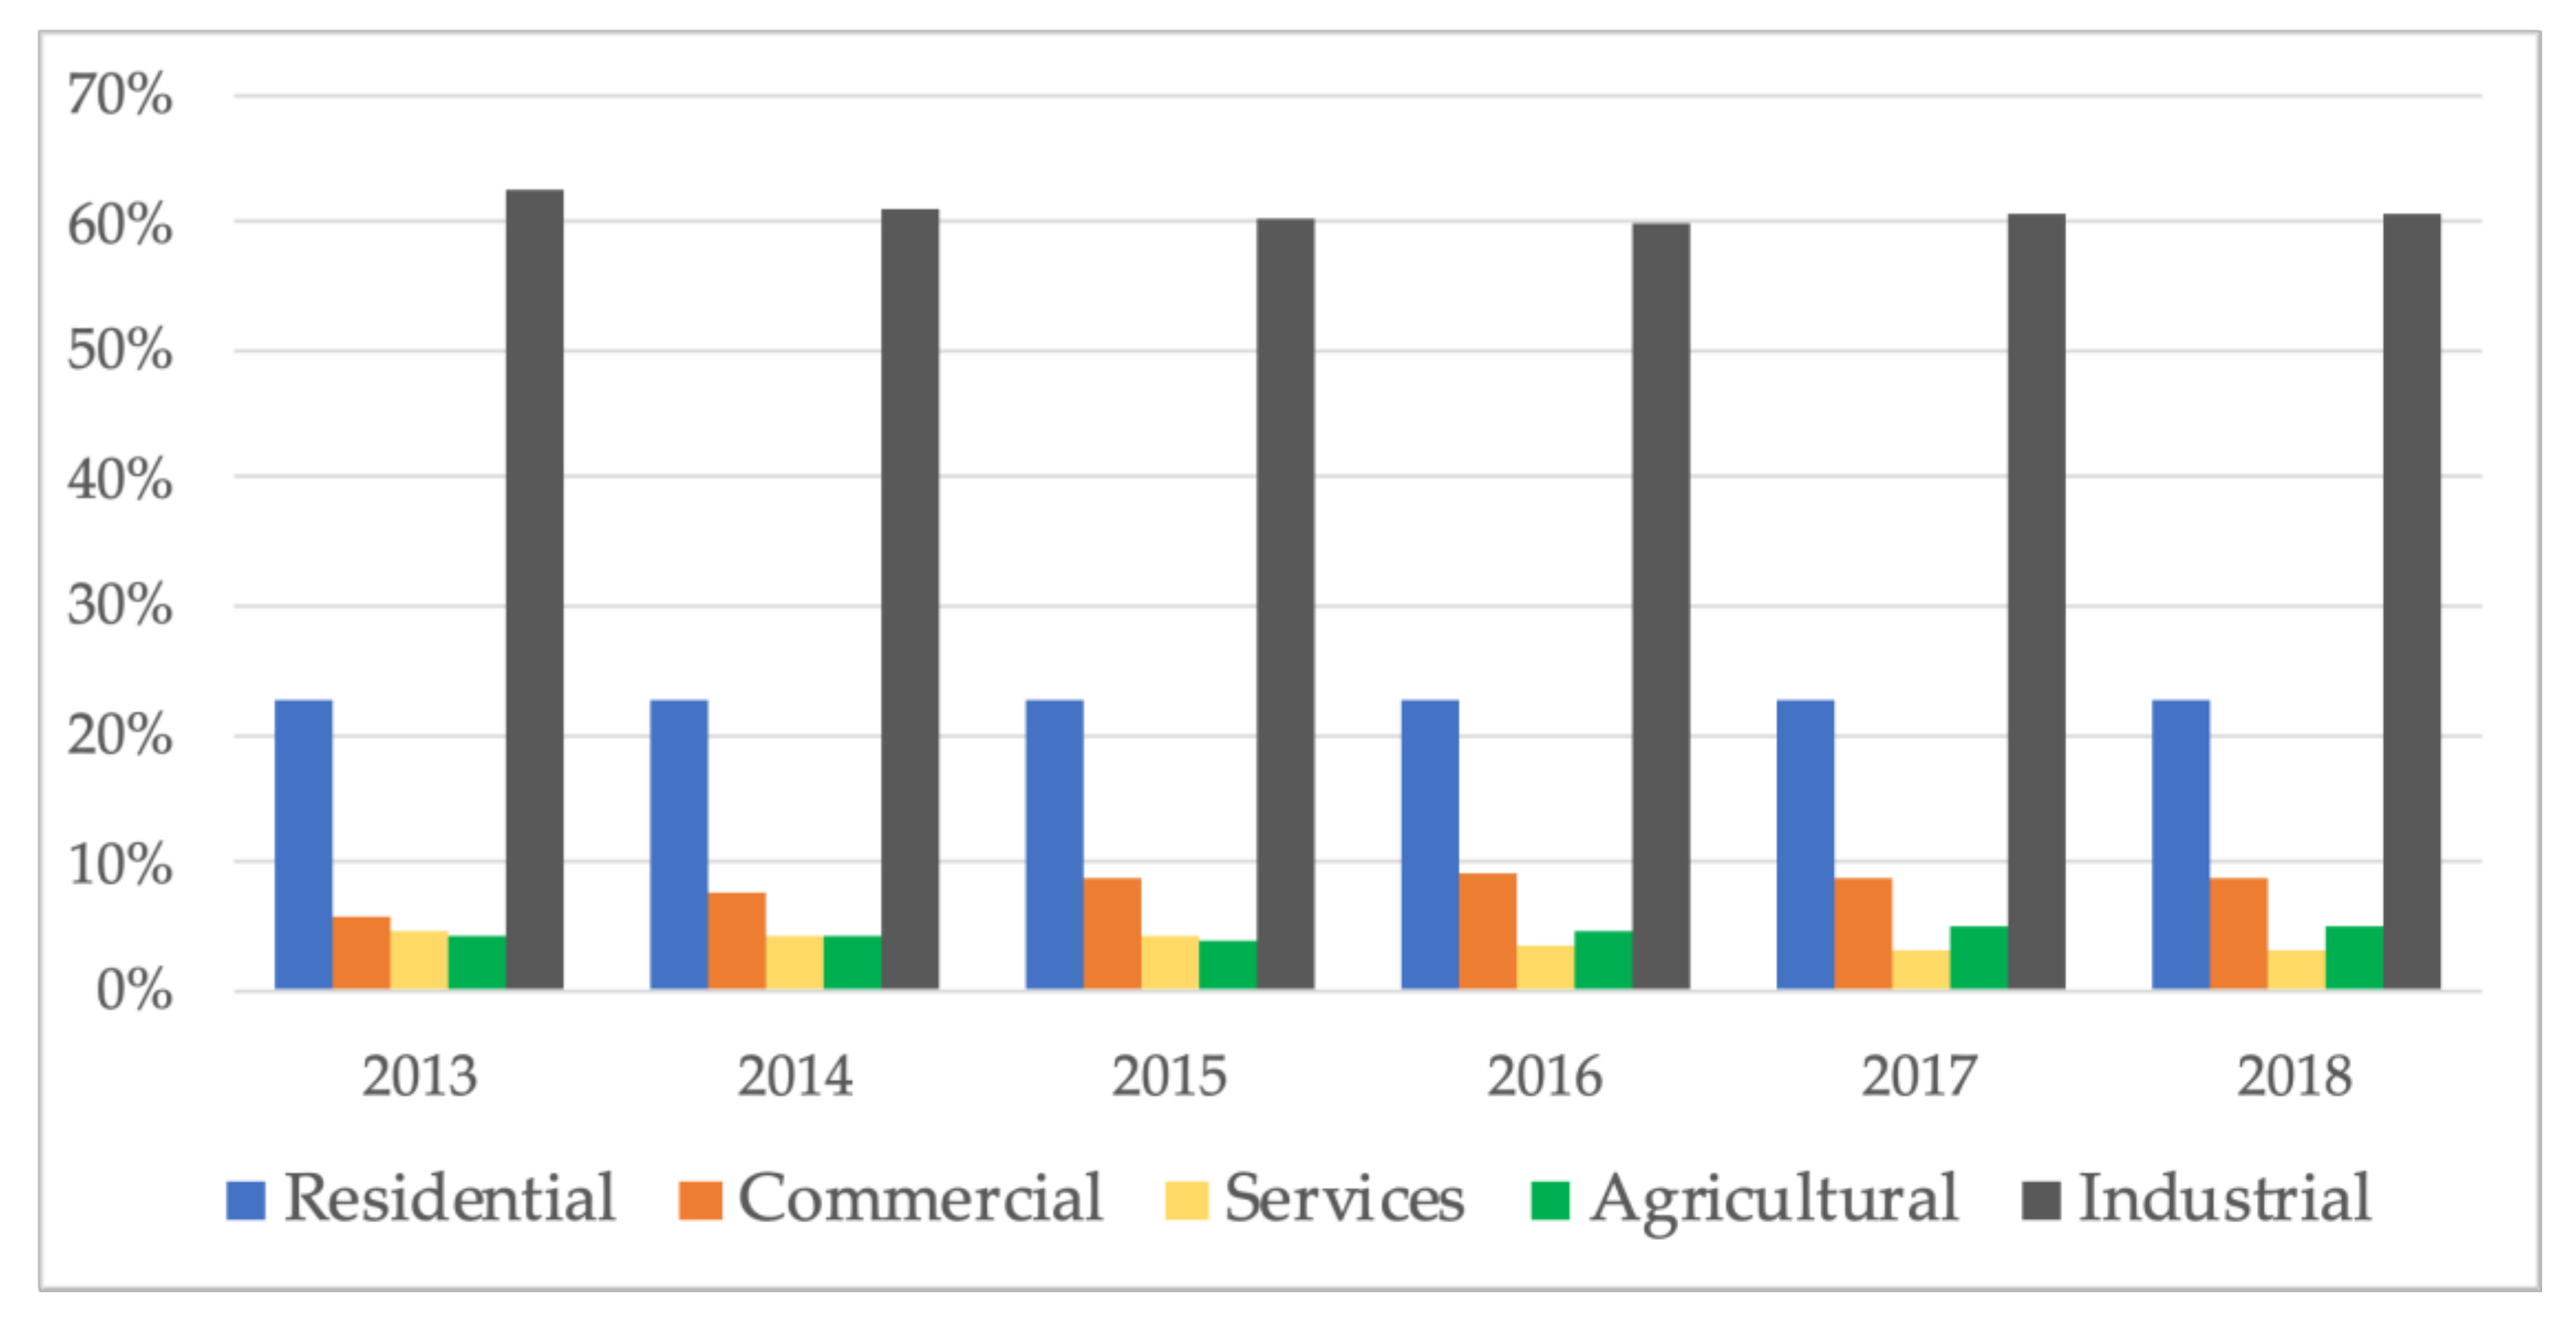
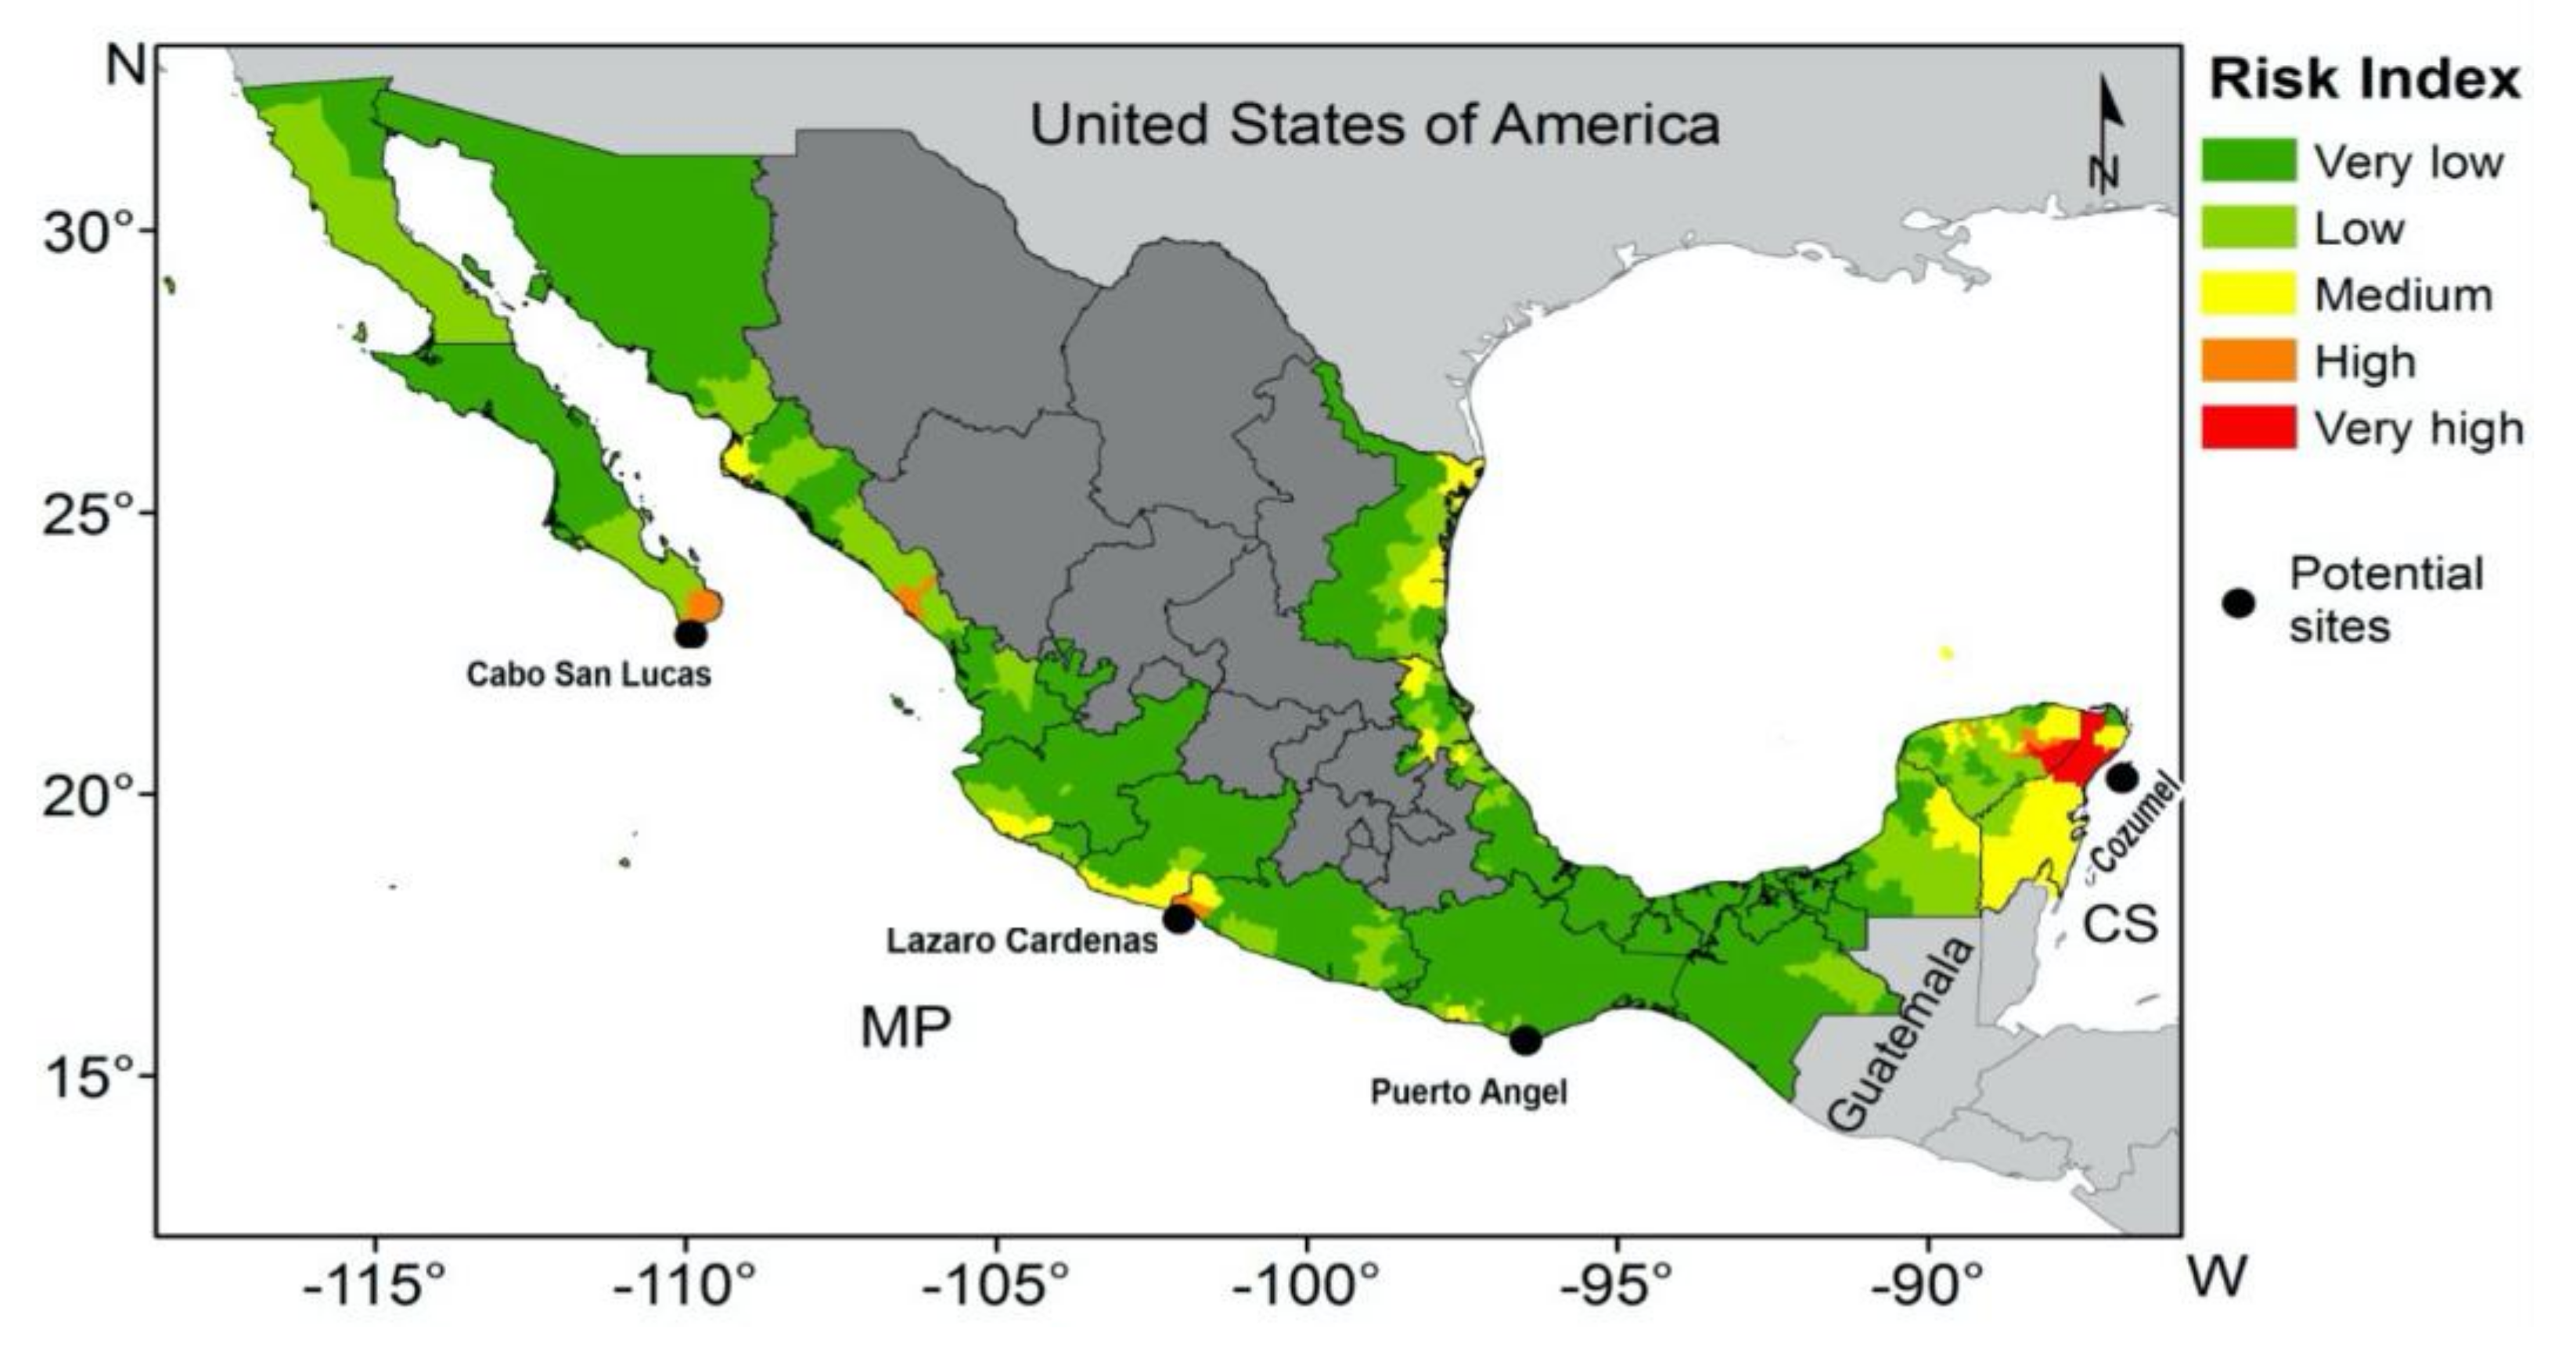
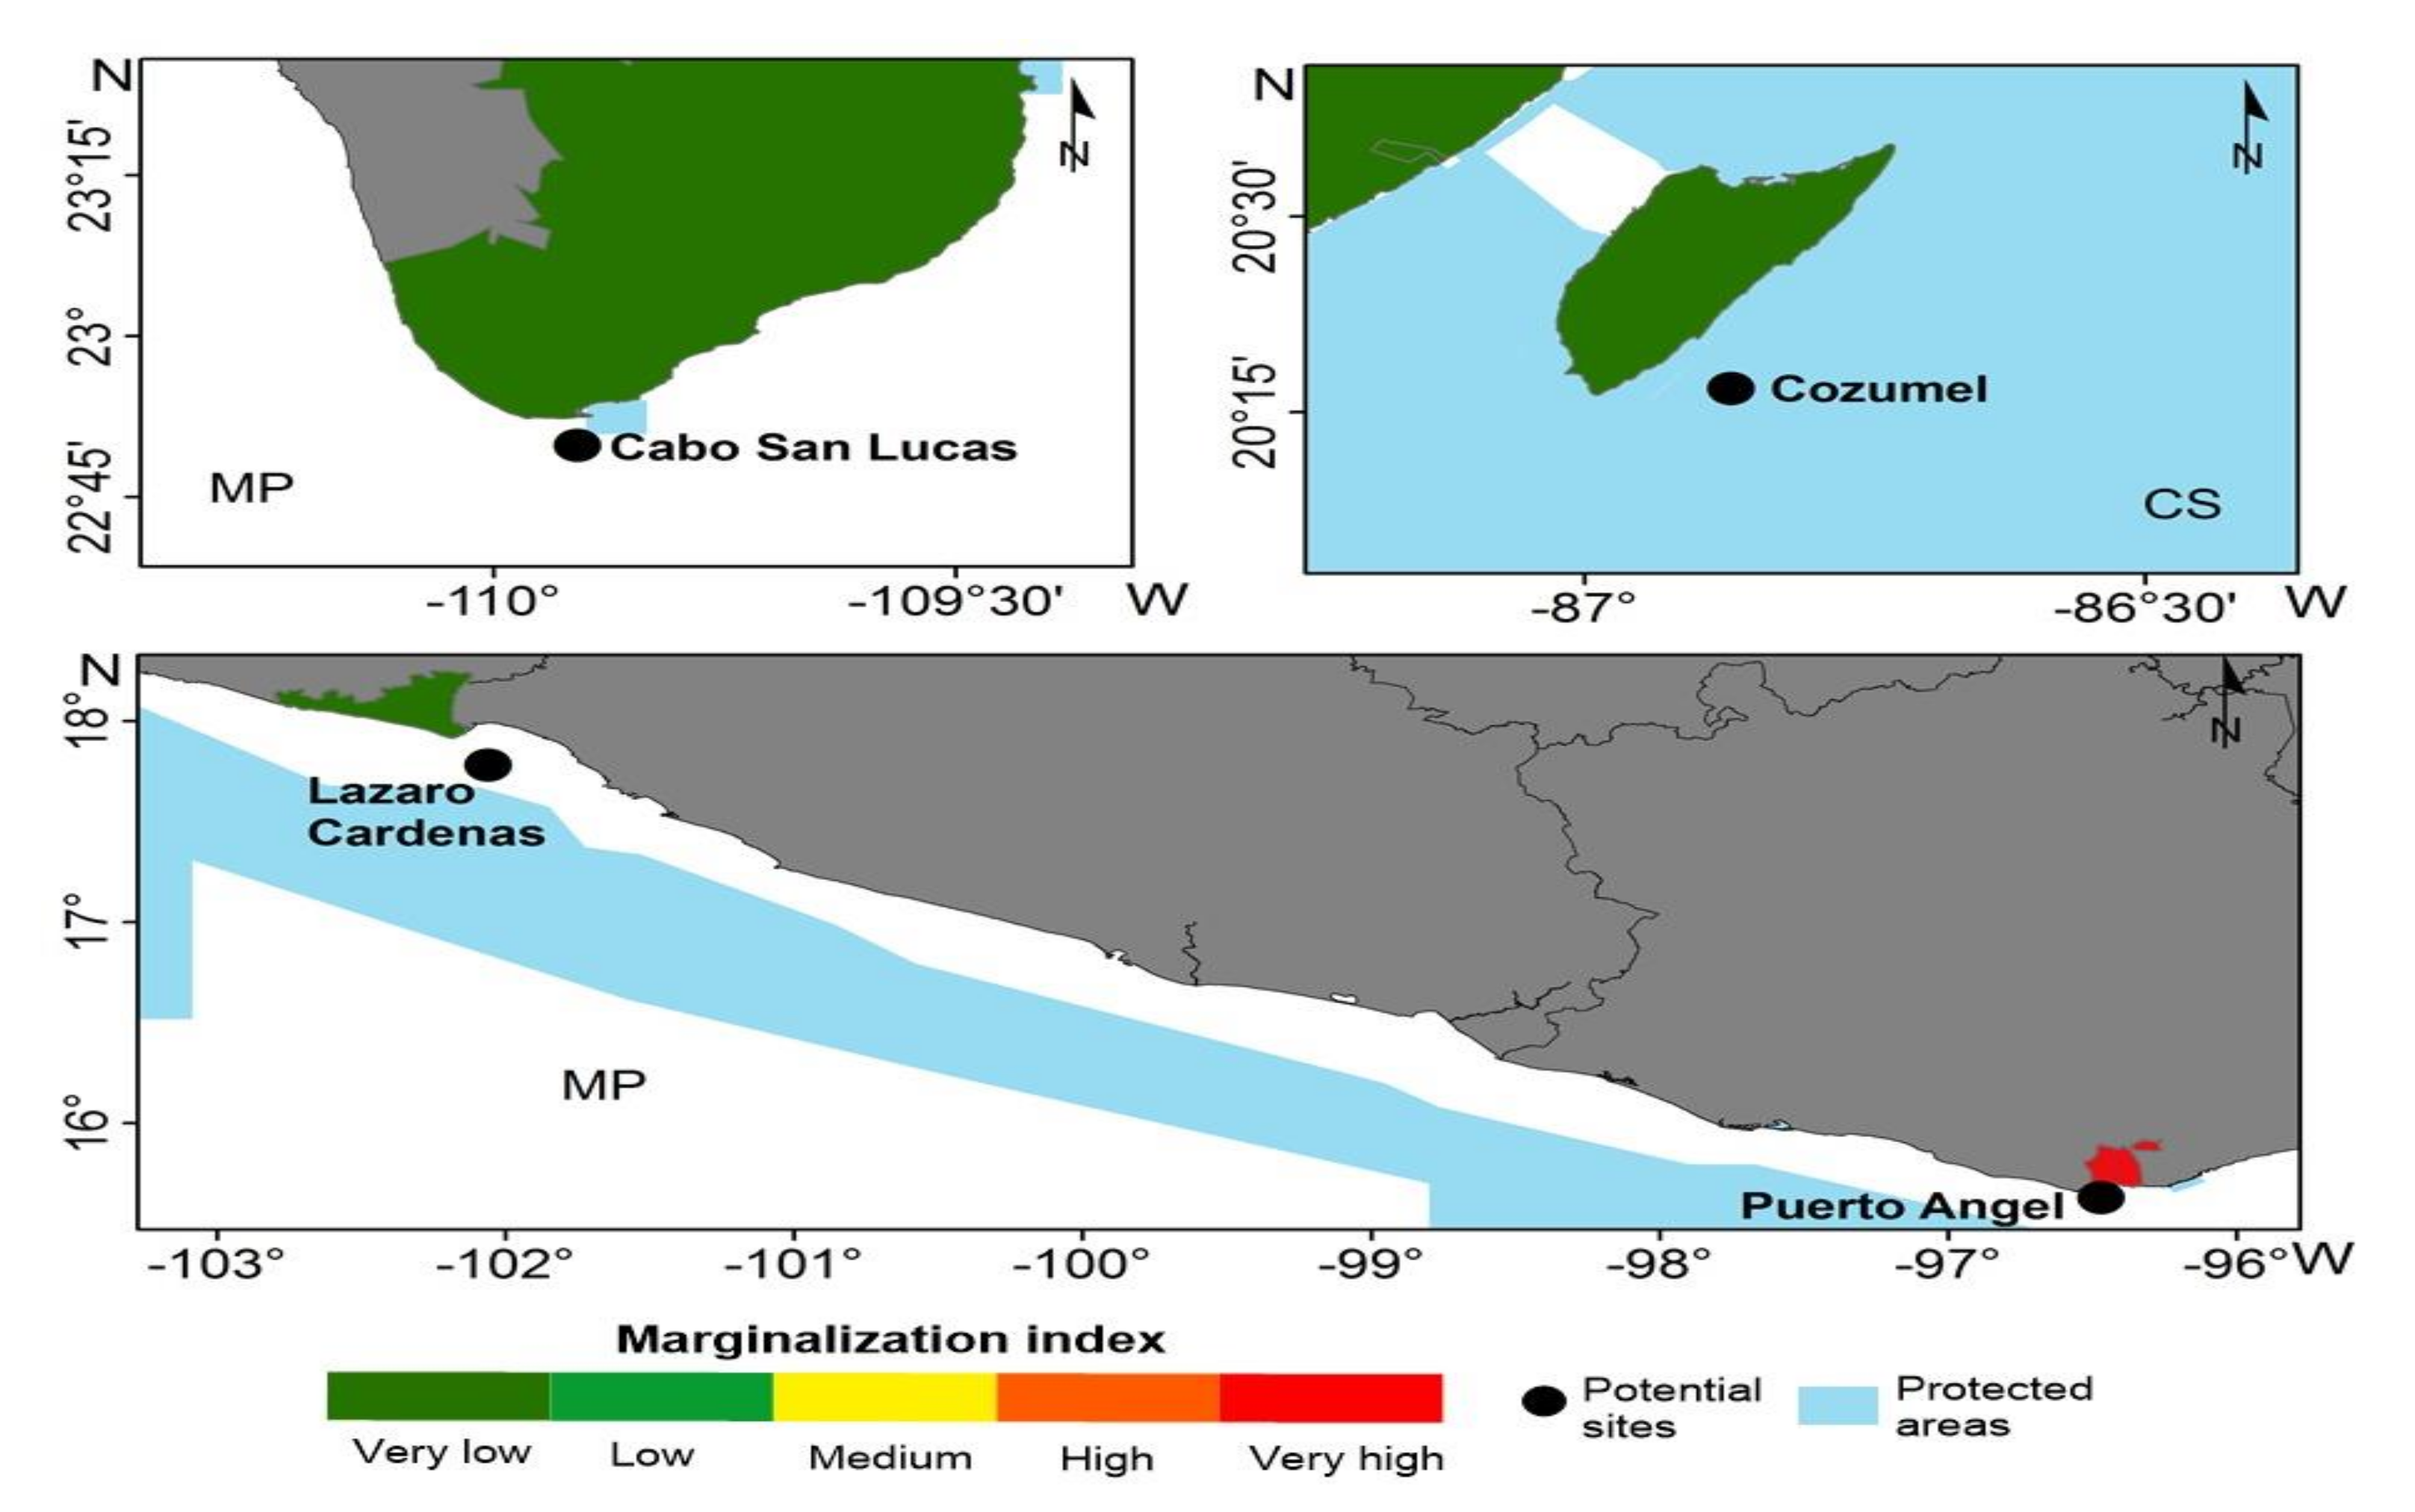
3.4. Environmental and Socioeconomic Criteria

The environmental and socioeconomic criteria involve the assessment of protected areas, marginalization index, homes without electricity, and Local Marginal Pricing (LMP).
Information regarding the socioeconomic characteristics of the four sites is given in Table 6. Puerto Angel has the highest percentage of homes without electricity at present, although the population itself is far smaller than that of the other sites. Lazaro Cardenas is one of the most populated cities in Michoacán, with 183,185 inhabitants.
The Marginalization Index (MI) and protected areas for the potential sites are shown in Figure 7. In general, the four sites have a very low level of MI, except Puerto Angel, with a high value. On the other hand, the environmental criteria show Cozumel is surrounded by 312,864 hectares of protected areas, designated as a Biosphere Reserve, and which contains the second-largest coral reef in the world [65] and has high biodiversity of marine mammals, such as Physeter macrocephalus, Kogia breviceps, Globicephala macrorhynchus and Trichechus manatus manatus [66]. The other sites have NPAs at different distances: Puerto Angel at 30 km, Lazaro Cardenas beyond ≈11 km and Cabo San Lucas at ≈2 km, where to the east there is a Flora and Fauna Protected Area. Based on this, it would be necessary to determine the occurrence of keystone, endemic or threatened species and potential threats owing to environmental changes before deploying OTEC plants. Marine mammals are abundant near Cabo San Lucas, so detailed studies could be necessary in this regard to determine potential environmental risks.
To understand the cost of energy at a specific node, the Local Marginal Pricing, LMP, was used, which was compared to the Local Residential Electricity Consumption, LREC (Equation (5)), for each location (Figure 8). The relationship shows that the sites with the highest LMP are Cabo San Lucas and Cozumel, which may be because they are areas with high electricity congestion, where baseload power is required to meet demand. From the above, an OTEC plant of the proposed generation capacity could satisfactorily cover residential consumption. The LREC estimates suggest that, in Puerto Angel, which is a small locality with a higher MI, residential consumption is low compared to one of the larger sites, such as Lazaro Cardenas, although the LMP indicates that there may be electricity congestion.

3.5. Optimum Sites

According to the methodology of Saaty (1990) [61], the weighting carried out is considered reasonable, given that the Consistency Radio (CR) was less than 0.1 (Table 7, Appendix A, Table A2 and Table A3.).
The evaluations carried out with the TOPSIS method determined that the best sites for OTEC implementation are Puerto Angel, in Oaxaca, and Cabo San Lucas, in Baja California Sur (Table 8).
The weightings (Table 7 and Table A3.) showed that the technical criteria, such as temperature differences, power availability, and distances to cold water intake, were the most important in the analysis. The effects of extreme events on OTEC plants have a low weighting since these could be mitigated if basic construction standards are complied with; this type of plant is designed to survive 100-year storms and other catastrophic events at the selected sites (e.g., earthquakes and extreme winds, waves, and currents) [67].
The environmental and socioeconomic criteria contemplated here are a first approach to establishing an effective instrument for the integral diagnosis of potential installation sites. In this study, these criteria are not considered as more important than the technical criteria because there is less information about them and, in the specific case of environmental aspects, these are usually related to assessments of prototypes that do not realistically reflect the impacts [68]. Therefore, their low weightings should not be interpreted as a disregard for their relevance in decision-making. Once the optimal sites have been found, using instruments such as those presented here, there is a need to delve deeper into the environmental and socioeconomic issues and establish a broader series of indicators that allow a more refined diagnosis for more accurate results, such as adding information about threatened or endemic species that are present in protected areas.
In socioeconomic aspects it is important to consider criteria such as potential impacts on cultural heritage and economic activities, as these are sensitive issues, as seen in the recent experience of resistance to renewable energy projects [69,70]. Before the installation of any device, an evaluation of the opinion of the affected population is very important, as transparency and participation of the community are factors that strongly influence the acceptance of a project [71].
Finally, in this work, the local marginal price and the distance to the electricity grid have low weightings since they do not represent a major issue for the deployment of OTEC.

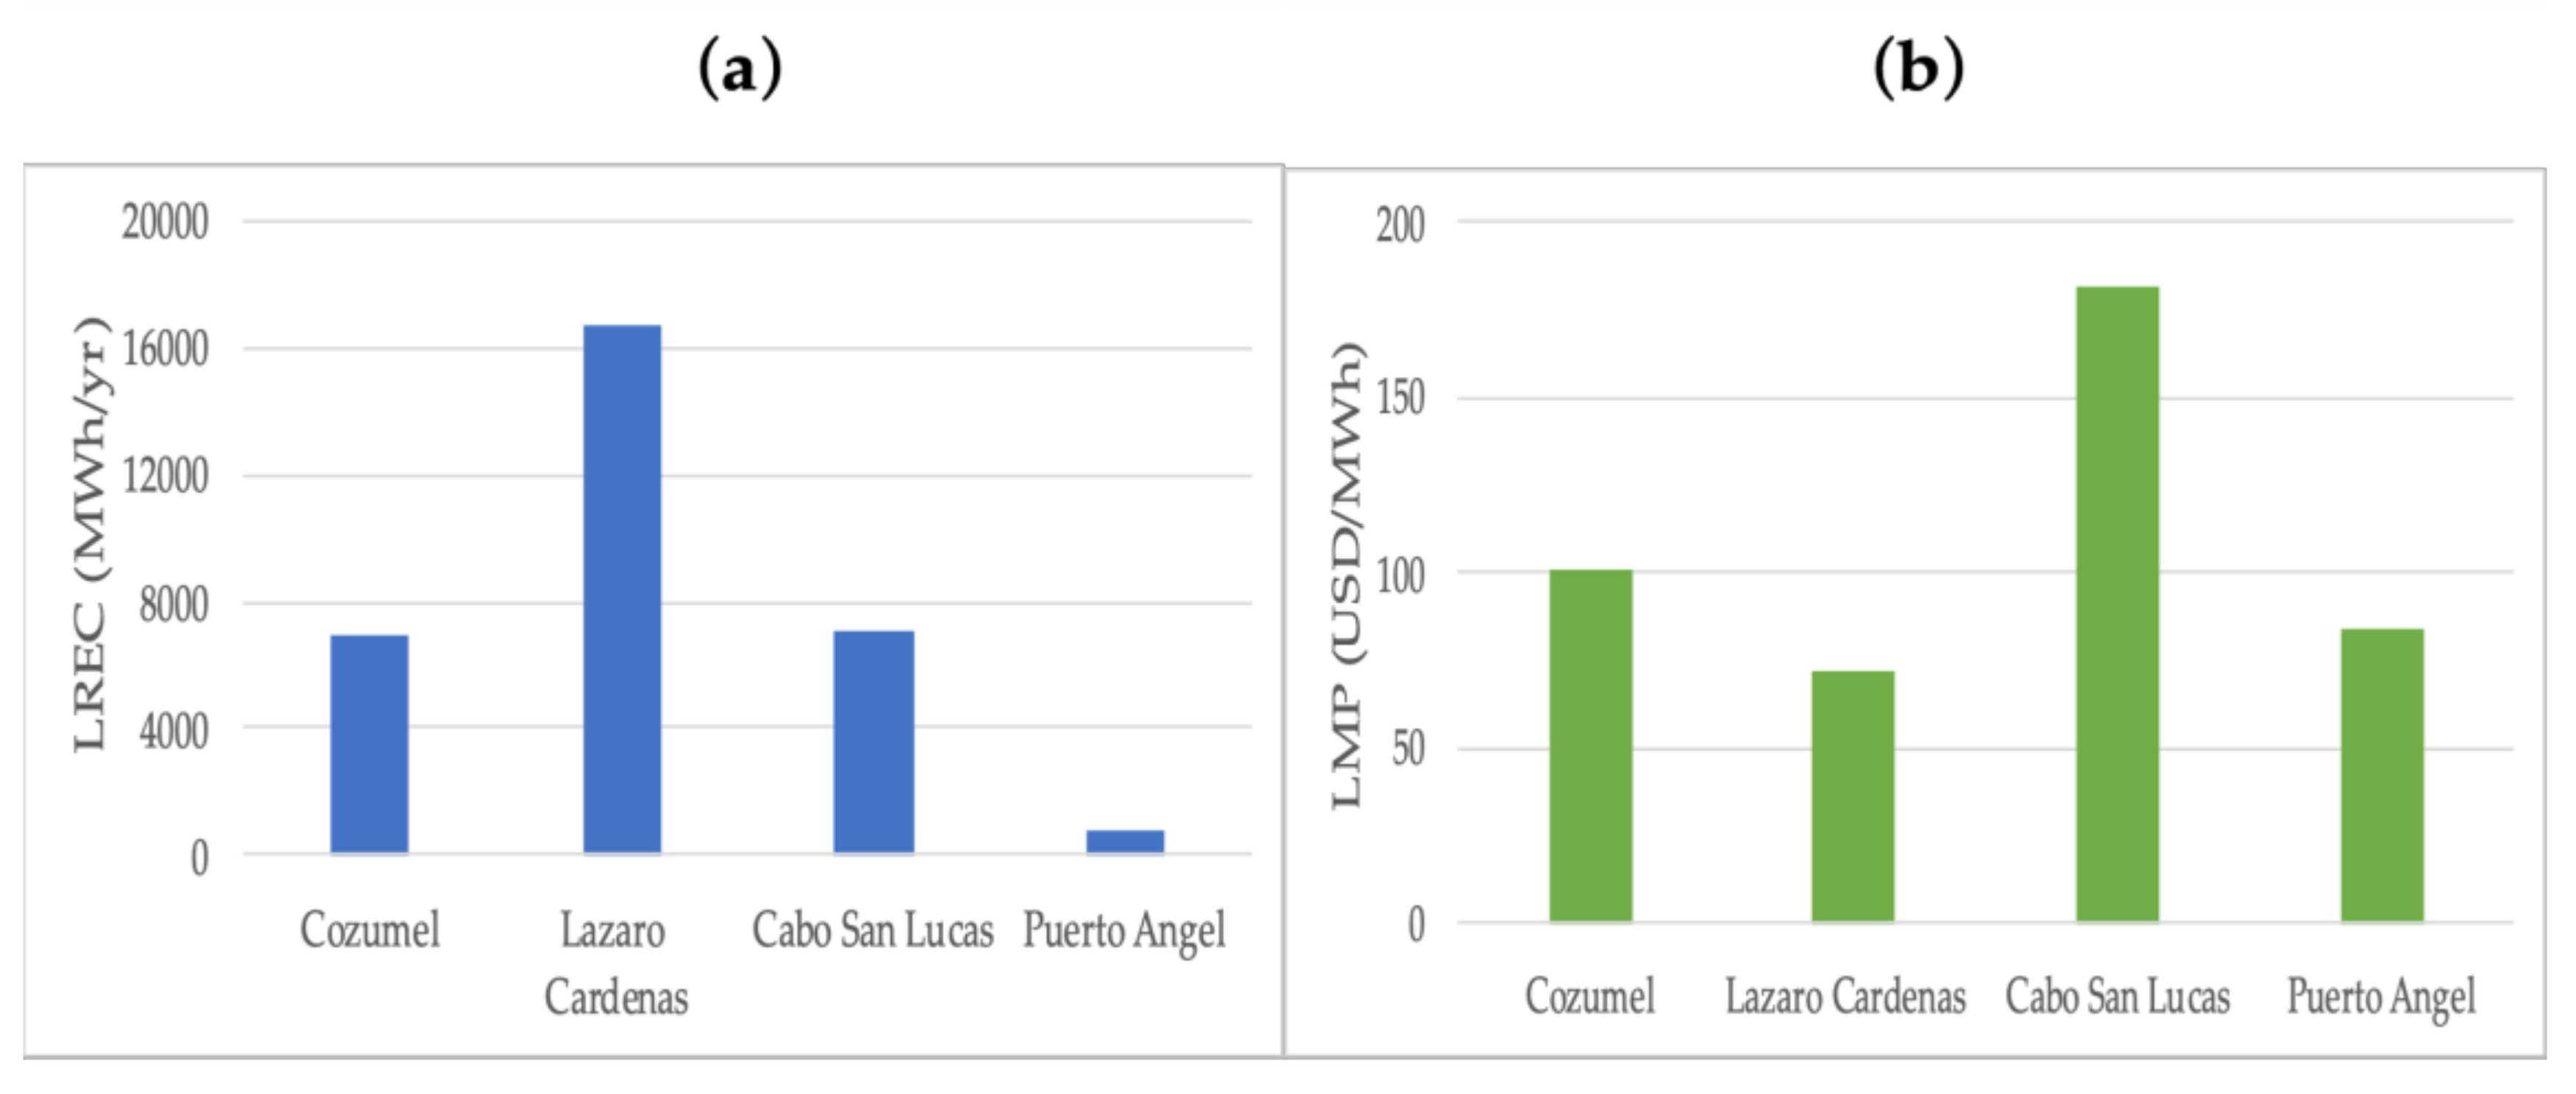
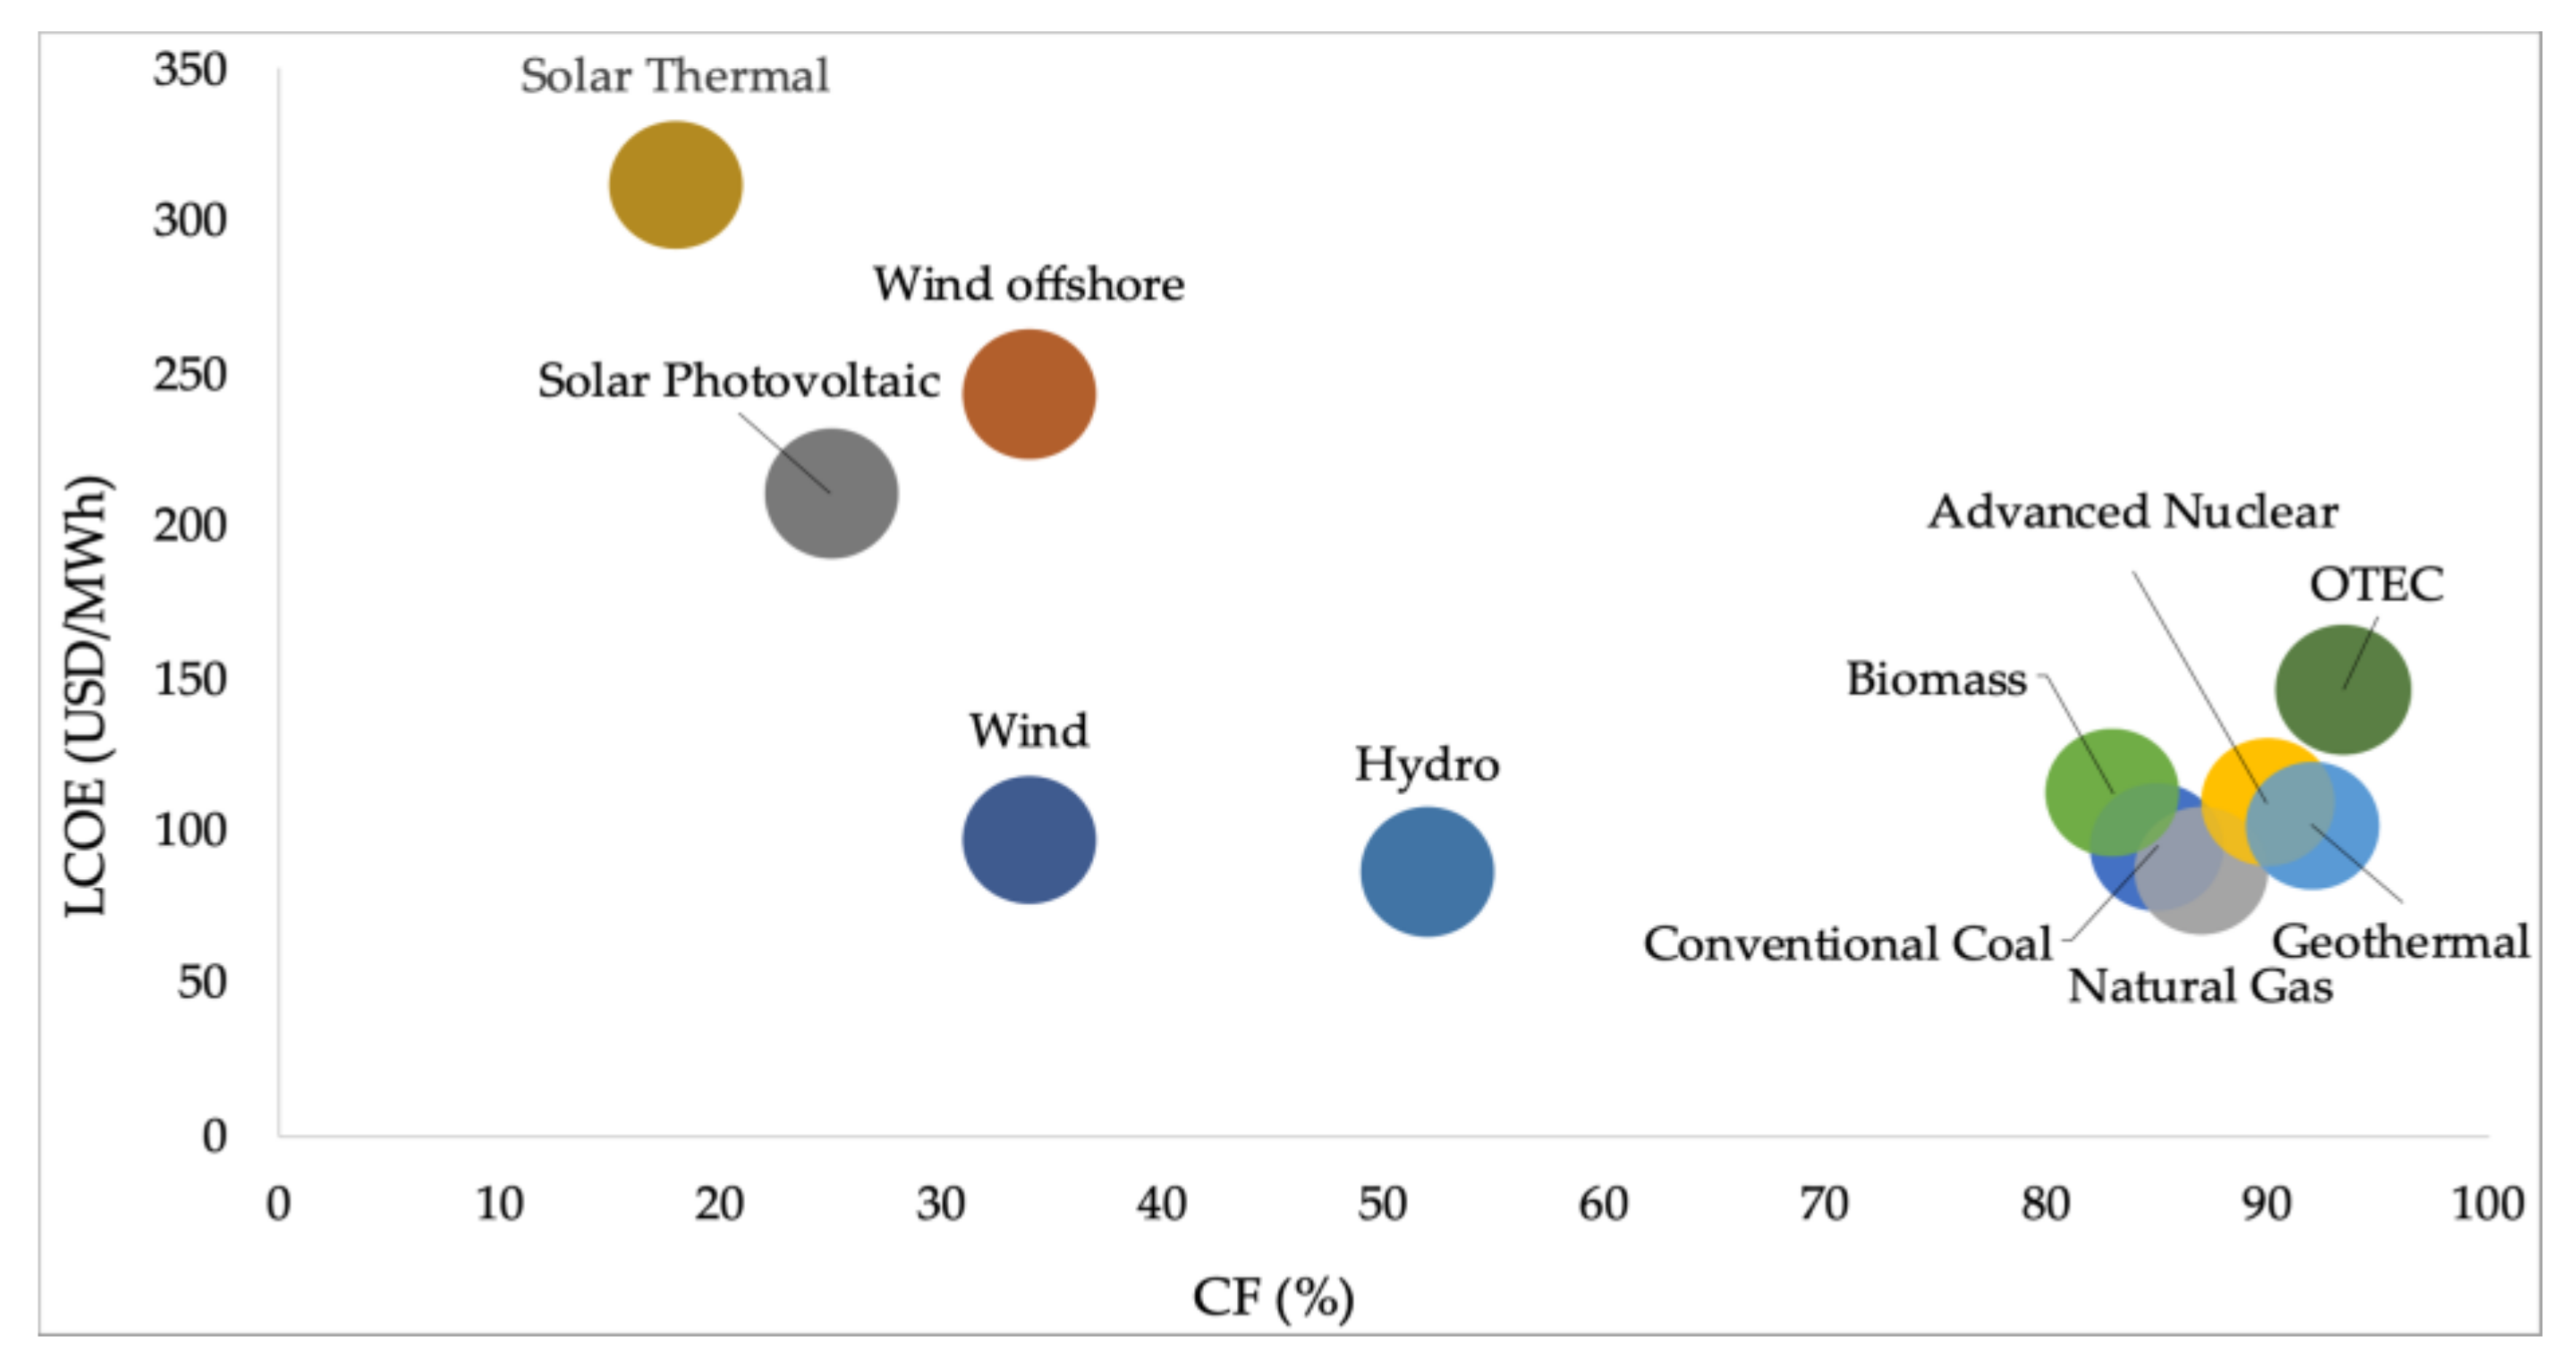
3.6. Levelised Cost of Energy (LCOE)

The LCOE of various power plants for 2009–2010 [8], based only on power generation, were compared to the costs for OTEC in 2010 (Figure 9). The LCOE of the OTEC-close cycle plant varies from 140 to 157 USD/MWh [11,72,73], which is one of the highest of conventional and renewable energy plants, such as Natural Gas, Geothermal, Biomass, Conventional Coal and Nuclear. However, it is much lower than the variable renewables, such as solar photovoltaic or offshore wind. Additionally, although the LCOE of OTEC is not yet competitive, it is one of the most promising technologies because of its high Capacity Factor (CF). This makes it attractive for markets that require high availability to supply baseload power, i.e., output can be adapted to meet demand.
OTEC plants also could have a competitive edge over other forms of energy generation, depending on their by-products, such as desalinated water, air conditioning, rich-nutrient water for aquaculture and cold-agriculture, etc., which could be valuable both socially and economically. In Japan and South Korea, where OTEC pilot plants are working only half of the year, a new market in by-products has developed, contributing to the local economy [74,75,76].

4. Conclusions

OTEC is a viable source of alternative energy, which can be sustainable, supply baseload power and strengthen the electricity sector. Although this type of technology is not yet at commercialisation stage, significant progress has been made in recent decades to improve its reliability. While the LCOE is still high compared to other forms of generation, further research and development will potentially reduce costs, as will the use of its by-products that create markets in the blue economy, offering social and economic benefits.
The main objective of this work was to provide a preliminary selection of optimal sites for the future deployment of an OTEC-50 MW (closed cycle) floating plant. The methodology included the theoretical estimation of the thermal potential from daily SST data (16 years) and an estimation of the power, presented as thresholds, for a distance of ≤15 km off the MP and CS coasts, at a depth of 1000 m. Environmental constraints, social needs, and electricity requirements were also assessed.
The results show that all four sites have suitable temperature differences (>20 °C). However, the distance to the cold-water intake, the availability of thermal potential, the vulnerability to extreme events, the distances to the electricity grid, the presence of NPAs and socio-economic needs vary from site to site. With the TOPSIS analysis, the ranking of the sites was (1) Puerto Angel, (2) Cabo San Lucas, (3) Cozumel and (4) Lazaro Cardenas. The last two being discarded mainly due to their distance from the cold-water intake and environmental restrictions that could affect the implementation of the plant. Puerto Angel and Cabo San Lucas have a potential electricity production of > 50 MW with a persistence of > 40%. Schemes at both of these sites are estimated to be feasible.
The Puerto Angel site is ideal both in the assessment of technical and environmental criteria. Within the socioeconomic context, its significant marginalization index means OTEC could be a viable option in contributing to supply the energy for coastal communities without electricity. Taking advantage of the by-products could also be valuable both socially and economically.
On the other hand, Cabo San Lucas is a feasible site for OTEC. Despite its variation in thermal potential, it is an area with considerable touristic and industrial activity, a great need for drinking water and base load power, combined with a high local marginal price and a lack of connections to the SIN. OTEC power could contribute to the energy supply and improve the quality of energy conditions of the region.
This study is intended to serve as a starting point for an assessment of operational pilot OTEC plants, before any large-scale project implementation. It is hoped that such assessments could serve in any region and help ensure sustainable project development. Besides the technical feasibility, before developing and deploying OTEC energy farms, it would be necessary to determine the potential socio-environmental impacts and consequences so that such new technologies are efficient, environmentally adequate and socioeconomically pertinent.

Author Contributions

Conceptualization, E.P.G.-R. and R.S.; methodology, E.P.G.-R., Y.R.-C.; A.G.-H. and J.O.-G.; validation, R.S.; M.L.M. and A.W.; formal analysis, E.P.G.-R., Y.R.-C. and A.G.-H.; investigation, E.P.G.-R., Y.R.-C., A.G.-H., M.L.M. and A.W.; data curation, Y.R.-C., R.M.-D. and S.C.-E.; writing—original draft preparation, E.P.G.-R., Y.R.-C., A.G.-H. and J.O.-G.; writing—review and editing, E.P.G.-R., R.S., M.L.M. and A.W., visualization, Y.R.-C.; supervision, R.S. and M.L.M., project administration, R.S. and E.P.G.-R.; funding acquisition, R.S. All authors have read and agreed to the published version of the manuscript.

Funding

This research was funded by CONACYT-SENER Sustentabilidad Energética project: FSE-2014-06-249795. Centro Mexicano de Innovación en Energía del Océano (CEMIE-Océano).

Data Availability Statement

The sea surface temperature database used in this paper was from SIMAR provided by Raúl Martell-Dubois and Sergio Cerdeira-Estrada from CONABIO (https://simar.conabio.gob.mx, 10 April 2021). The temperature at 1000 m depth was taken from World Ocean Atlas, 2013 (https://www.nodc.noaa.gov/OC5/woa13/, 10 April 2021) and the bathymetry of the study area was taken from GEBCO, 2017 (https://www.gebco.net/, 10 April 2021). Natural Protected Areas were taken from CONANP database (http://sig.conanp.gob.mx/website/pagsig/info_shape.htm, 10 April 2021). The Marginalization Index was taken from CONAPO (https://www.gob.mx/conapo/, 10 April 2021). The percentage of households without access to electricity, taken from the SEDESOL (https://www.gob.mx/inea/documentos/secretaria-de-desarrollo-social-164377, 10 April 2021).The Local Marginal Pricing was from CENACE (https://www.gob.mx/cenace, 10 April 2021).

Acknowledgments

We would like to thank Daniel Garduño-Ruiz for his support in the process of sea surface temperature data. The Centro Mexicano de Innovación en Energía del Océano (CEMIE-Océano) for providing us support in the research. Finally, the 8th OTEC symposium for providing us an opportunity to publish our research work through this Special Issue.

Conflicts of Interest

The authors declare no conflict of interest.

Abbreviations

AHPAnalytic Hierarchy Process
BCSBaja California Sur
CCClosed Cycle
CEMIE-OcéanoMexican Centre for Innovation in Ocean Energy
CFCapacity Factor
CMPCentral MP
Cold AgCold Agriculture
CRConsistency Radio
CSCaribbean Sea
CTECCoastal Thermal Gradient Energy
DMDecision Matrix
DOWADeep Ocean Water Applications
EEZMexican Exclusive Economic Zone
ENSONiño-Southern Oscillation
ETPEastern Tropical Pacific
FFFossil Fuel
GCGulf of California
GEBCOGeneral Bathymetric Chart of the Oceans
GISGeographic Information System
HHybrid
HELHomes with Electricity at the Local level (homes)
HENHomes with Electricity at National Level (homes)
KRISOKorea Research Institute of Ships & Ocean engineering
LCOELevelized Cost of Energy
LMPLocational Marginal Price
LRECLocal Residential Electricity Consumption (MWh/yr)
MCDAMulti-Criteria Decision Analysis
MIMarginalization Index
MPMexican Pacific
MREMarine Renewable Energy
NEMNational Energy Matrix
NPNorthwest Pacific
NPANatural Protected Areas
NRECNational Residential Electricity Consumption (MWh/yr)
OCOpen Cycle
OTECOcean Thermal Energy Conversion
PPersistencies (%)
PnetOTEC net power (MW)
PpumpPumping Power (MW/K)
QcwVolume of cold-water flow (m3/s)
RERenewable Energies
SATMOOceanic Monitoring Satellite System
SENSIMARNational Electricity GridCoastal Marine Information and Analysis System
SINInterconnected National Grid
SMPSouthern MP
SSTSea Surface Temperature
SWACSeawater Air Conditioning
TAbsolute temperature of the surface seawater (K)
TCTropical Cyclones
TdDeep Ocean Temperature
TEThermal Energy
TOPSISTechnique for Order Performance by Similarity to Ideal Solution
WOAWorld Ocean Atlas
WODWorld Ocean Database
ρ Average density of seawater (1025 kg/m3)
ε t Efficiency of the turbogenerator (0.75)
γ Ratio between the hot and cold-water flows (1.5)
T m Sea water temperature difference between the surface andthe depth of 1000 (°C)
c p Specific enthalpy of seawater (0.004 MJ/kgK)

Appendix A

Corresponding to the decision matrix evaluated with MCDA.
Table A1. Decision matrix evaluating the different alternatives and criteria.
Criteria
Alternatives(a)(b)(c)(d)(e)(f)(g)(h)(i)
Cozumel5.4229.071005.001.001.000.22100.5444.16
Lazaro Cardenas21.8629.521004.000.001.000.4371.8532.13
Cabo San Lucas7.4828.62425.000.001.000.63181.396.74
Puerto Angel3.9129.411002.000.004.003.2884.4412.67
(a) Distance to cold-water intake at 1000 m depth (km); (b) Temperature difference (°C); (c) Power availability (persistence in %); (d) Extreme events; (e) Protected areas; (f) Marginalization Index; (g) Homes without electricity (%); (h) Local Marginal Price (USD/MWh) and (i) Distance to the electricity grid (km).
Table A2. Comparative decision matrix for the AHP method.
Criteria(a)(b)(c)(d)(e)(f)(g)(h)(i)
(a)1.001.001.003.003.005.003.003.003.00
(b)1.001.001.005.005.007.005.003.003.00
(c)1.001.001.005.005.007.005.003.003.00
(d)0.330.200.201.001.001.003.003.003.00
(e)0.330.200.201.001.001.003.003.003.00
(f)0.200.140.141.001.001.001.001.003.00
(g)0.330.200.200.330.331.001.001.003.00
(h)0.330.330.330.330.331.001.001.001.00
(i)0.330.330.330.330.330.330.331.001.00
Table A3. Normalized decision matrix and weights for the AHP method.
Criteria(a)(b)(c)(d)(e)(f)(g)(h)(i)Weighing
(a)0.210.230.230.180.180.210.130.160.130.18
(b)0.210.230.230.290.290.290.220.160.130.23
(c)0.210.230.230.290.290.290.220.160.130.23
(d)0.070.050.050.060.060.040.130.160.130.08
(e)0.070.050.050.060.060.040.130.160.130.08
(f)0.040.030.030.060.060.040.040.050.130.05
(g)0.070.050.050.020.020.040.040.050.130.05
(h)0.070.080.080.020.020.040.040.050.040.05
(i)0.070.080.080.020.020.010.010.050.040.04

References

  1. Vega, L. Ocean Thermal Energy Conversion. In Encyclopedia of Sustainability Science and Technology; Meyers, R.A., Ed.; Springer: New York, NY, USA, 2012; pp. 7296–7328. [Google Scholar]
  2. Bernardoni, C.; Binotti, M. Techno-economic analysis of closed OTEC cycles for power generation. Renew. Energy. 2019, 132, 1018–1033. [Google Scholar] [CrossRef]
  3. International Renewable Energy Agency (IRENA). Ocean Thermal Energy Conversion: Technology Brief. IRENA Ocean Energy Technol. Br. 2014, 1, 32. [Google Scholar]
  4. Kobayashi, H.; Jitsuhara, S.; Uehara, H. The Present Status and Features of OTEC and Recent Aspects of Thermal Energy Conversion Technologies; National Maritime Research Institute: Mitaka, Tokyo, 2001; pp. 1–8. [Google Scholar]
  5. OES. OES Annual Report 2018|Main achievements in 2018|Task 11—Ocean thermal Energy Conversion. 2018. Available online: https://report2018.ocean-energy-systems.org/main-achievements-in-2018/task-11-ocean-thermal-energy-conversion/ (accessed on 24 November 2019).
  6. OES|Ocean Energy Systems—An IEA Technology Collaboration Programme. Available online: https://www.ocean-energy-systems.org/ (accessed on 24 November 2019).
  7. Technology, P. Makai’s Ocean Thermal Energy Conversion (OTEC) Power Plant, Hawaii. Available online: https://www.power-technology.com/projects/makais-ocean-thermal-energy-conversion-otec-power-plant-hawaii/ (accessed on 1 January 2021).
  8. U.S. Energy Information Administration. Annual Energy Outlook 2009, With Projections to 2030. Available online: https://www.eia.gov/outlooks/aeo/electricity_generation.php (accessed on 4 March 2018).
  9. Twidell, J.; Weir, T. Renewable Energy Resources, 2nd ed.; Taylor & Francis: London, UK; Milton Park, UK, 2006. [Google Scholar]
  10. Vega, L.; Michaelis, D. First generation 50 MW OTEC plantship for the production of electricity and desalinated water. Proc. Annu. Offshore Technol. Conf. 2010, 4, 2979–2995. [Google Scholar]
  11. Vega, L. Economies of ocean thermal energy conversion (OTEC): An update. Proc. Annu. Offshore Technol. Conf. 2010, 4, 3239–3256. [Google Scholar]
  12. Hernández-Fontes, J.V.; Felix, A.; Mendoza, E.; Cueto, Y.R.; Silva, R. On the Marine Energy Resources of Mexico. J. Mar. Sci. Eng. 2019, 7, 191. [Google Scholar] [CrossRef] [Green Version]
  13. García-Huante, A.; Rodríguez-Cueto, Y.; Garduño-Ruiz, E.P.; Hérnadez-Contreras, R. General Criteria for Optimal Site Selection for the Installation of Ocean Thermal Energy Conversion (OTEC) Plants in the Mexican Pacific. In Intech; IntechOpen: London, UK, 2020; p. 15. [Google Scholar]
  14. Alatorre-Mendieta, A.; Garcia Huante, A.; Cerezo-Acevedo, E.; Barcenas-Graniel, J.; Jimenez, F.; Silva, R. OTEC Instalation Posibilities in Mexico. In Proceeding of the 5th OTEC Symposium, La Réunion, France, 7–9 November 2017. [Google Scholar]
  15. Mendoza, E.; Lithgow, D.; Flores, P.; Felix, A.; Simas, T.; Silva, R. A framework to evaluate the environmental impact of OCEAN energy devices. Renew. Sustain. Energy Rev. 2019, 112, 440–449. [Google Scholar] [CrossRef]
  16. Paredes, M.G.; Padilla-Rivera, A.; Güereca, L.P. Life cycle assessment of ocean energy technologies: A systematic review. J. Mar. Sci. Eng. 2019, 7, 322. [Google Scholar] [CrossRef] [Green Version]
  17. Giraud, M.; Garçon, V.; de la Broise, D.; L’Helguen, S.; Sudre, J.; Boye, M. Potential effects of deep seawater discharge by an Ocean Thermal Energy Conversion plant on the marine microorganisms in oligotrophic waters. Biogeosci. Discuss. 2018, 475, 1–33. [Google Scholar] [CrossRef]
  18. Wojtarowski, A. Will Cozumel be able to capitalize its potential for the development of maritime energy? An analysis from the attitude towards alternative energies. Rev. Sociológica Pensam. Crítico 2020, 14, 31–58. [Google Scholar]
  19. Carrera-Chan, E.; Sabido-Tun, M.F.; Bárcenas-Graniel, J.F.; Cerezo-Acevedo, E.; Diaz Masuelli, D. Environmental Impact Assessment of the Operation of an Open Cycle OTEC 1MWe Power Plant in the Cozumel Island, Mexico. In Ocean Thermal Energy Conversion (OTEC)—Past, Present, and Progress; Intech Open: London, UK, 2020; p. 13. [Google Scholar]
  20. Hernández-Fontes, J.V.; Martínez, M.L.; Wojtarowski, A.; González-Mendoza, J.L.; Landgrave, R.; Silva, R. Is ocean energy an alternative in developing regions? A case study in Michoacan, Mexico. J. Clean. Prod. 2020, 266, 121984. [Google Scholar] [CrossRef]
  21. Secretaría de Energía (SENER). Prospectiva de Energías Renovables 2017–2031; SENER: México City, México, 2017. [Google Scholar]
  22. Organización de Naciones Unidas (ONU). Proyecto de Documento Final de la Cumbre de las Naciones Unidas Para la Aprobación de la Agenda para el Desarrollo Después de 2015; United Nations: New York, NY, USA, 2015; Available online: https://www.un.org/ga/search/view_doc.asp?symbol=A/69/L.85&Lang=S (accessed on 19 February 2021).
  23. Union of Concerned Scientist. Los Costos Ocultos de Los Combustibles Fósiles. 2018. Available online: https://es.ucsusa.org/resources/costos-ocultos-combustibles-fosiles (accessed on 22 February 2021).
  24. Centro Nacional de Control de Energía|Gobierno|gob.mx. Available online: https://www.gob.mx/cenace (accessed on 24 November 2019).
  25. Secretaría de Energía (SENER), Sistema de Información Energética; SENER: México. Available online: http://sie.energia.gob.mx/ (accessed on 25 November 2019).
  26. Centro Nacional de Control de la Energía (CENACE). Precios Marginales Locales. México. 2019. Available online: https://www.cenace.gob.mx/Paginas/SIM/Reportes/PreciosEnergiaSisMEM.aspx. (accessed on 5 August 2020).
  27. Chiappa-Carrara, X.; Enríquez, C.; Papiol, V.; Mariño-Tapia, I.; Reyes-Hernández, C. Pacific coast of Mexico in World Seas: Environ. Eval, 2nd ed.; Sheppard, C., Ed.; Elsevier Academic Press: London, UK, 2019; pp. 655–671. [Google Scholar]
  28. García-Huante, A.; Rodríguez-Cueto, Y.; Silva, R.; Mendoza, E.; Vega, L. Determination of the potential thermal gradient for the Mexican Pacific Ocean. J. Mar. Sci. Eng. 2018, 6, 20. [Google Scholar] [CrossRef] [Green Version]
  29. Valdez-Holguin, J.E.; Gaxiola-Castro, G.; Cervantes-Duarte, R. Primary productivity in the Gulf of California, calculated from the relationship between superficial irradiance and chlorophyll in the euphotic zone. Ciencias Mar. 1995, 21, 311–329. [Google Scholar] [CrossRef] [Green Version]
  30. Márquez-Artavia, A.; Sánchez-Velasco, L.; Barton, E.D.; Paulmier, A.; Santamaría-Del-Ángel, E.; Beier, E. A suboxic chlorophyll-a maximum persists within the Pacific oxygen minimum zone off Mexico. Deep. Res. Part II Top. Stud. Oceanogr. 2019, 169–170, 104686. [Google Scholar] [CrossRef]
  31. Lara-Lara, J.R. Distribución de clorofila y producción primaria por clases de tamaño en la costa del Pacífico mexicano. Ciencias Mar. 2005, 31, 11–21. [Google Scholar] [CrossRef] [Green Version]
  32. Rioja-Nieto, R.; Garza-Pérez, R.; Álvarez-Filip, L.; Mariño-Tapia, I.; Enríquez, C. The Mexican Caribbean: From Xcalak to Holbox, 2nd ed.; Elsevier Ltd.: Amsterdam, The Netherlands, 2018. [Google Scholar]
  33. Athie, G.; Candela, J.; Sheinbaum, J.; Badan, A.; Ochoa, J. Yucatan Current variability through the Cozumel and Yucatan channels. Ciencias Mar. 2011, 37, 471–492. [Google Scholar] [CrossRef] [Green Version]
  34. Bárcenas-Graniel, J. Evaluación del Potencial de Conversión de Energía Renovable en el Caribe Mexicano. Master’s Thesis, Universidad Nacional Autónoma de México, Instituto de Ciencias del Mar y Limnología, Mexico City, Mexico, 2014. [Google Scholar]
  35. GEBCO. General Bathymetric Chart of the Oceans. Available online: https://www.gebco.net/ (accessed on 15 January 2018).
  36. NOAA. National Oceanic and Atmospheric Administration, WOA (2013), World Ocean Atlas. 2013. Available online: https://www.nodc.noaa.gov/OC5/woa13/ (accessed on 5 February 2019).
  37. Stewart, R.H. Introduction to Physical Oceanography; Prentice Hall: Hoboken, NJ, USA, 2008; p. 353. [Google Scholar]
  38. Cerdeira-Estrada, S.; López-Saldaña, G. A novel Satellite-based Ocean Monitoring System for Mexico. Ciencias Mar. 2011, 37, 237–247. [Google Scholar] [CrossRef] [Green Version]
  39. Cerdeira-Estrada, S.; Martell-Dubois, R.; Valdéz-Chavarin, J.; Rosique-de la Cruz, L.; Perera-Valderrama, S.; López-Perea, J.; Caballero-Aragón, H.; Ressl, R. Marine-Coastal Information and Analysis System (SIMAR). CONABIO, Mexico. Available online: https://simar.conabio.gob.mx (accessed on 24 November 2019).
  40. Rajagopalan, K.; Nihous, G.C. An Assessment of Global Ocean Thermal Energy Conversion Resources with a High-Resolution Ocean General Circulation Model. J. Energy Resour. Technol. 2013, 135, 1–9. [Google Scholar] [CrossRef] [Green Version]
  41. Departamento de Comercio de los EE.UU; Agencia Nacional del Océano y la Atmósfera de los EE.UU. (NOAA). Ciclones Tropicales. Guía de Preparación; 2013. Available online: https://www.weather.gov/media/owlie/ciclones_tropicales11.pdf (accessed on 31 August 2020).
  42. Centro Nacional de Prevención de Desastres (CENAPRED). Atlas Nacional de Riesgo. México. 2017. Available online: http://www.atlasnacionalderiesgos.gob.mx/app/peligro_ciclones_tropi.php (accessed on 31 August 2020).
  43. Centro Nacional de Control de la Energía (CENACE). Diagramas Unifilares del Sistema Eléctrico Nacional. Programa Ampl. Mod. 2016, 1, 141. [Google Scholar]
  44. Centro Nacional de Control de la Energía (CENACE). Programa de Ampliación y Modernización de la Red Nacional de Transmisión y Redes Generales de Distribución del Mercado Electro Mayorista. PRODESEN 2019–2033; México. 2019. Available online: https://www.energiaestrategica.com/el-prodesen-2019-2033-planea-mas-de-50-proyectos-de-expansion-de-redes-de-transmision-y-distribucion-para-lograr-una-mejor-integracion-de-renovables/ (accessed on 31 August 2020).
  45. Instituto Nacional de Estadística y Geografía (INEGI). Encuesta Intercensal. México. 2015. Available online: https://www.inegi.org.mx/programas/intercensal/2015/default.html#Microdatos (accessed on 31 August 2020).
  46. Consejo Nacional de Población y Vivienda (CONAPO). Índice de marginación por entidad Federativa y Municipio 2010. México; 2010. Available online: http://www.conapo.gob.mx/es/CONAPO/Datos_Abiertos_del_Indice_de_Marginacion (accessed on 28 August 2020).
  47. Comisión Nacional de Áreas Naturales Protegidas (CONANP). Áreas Naturales Protegidas Federales de la República Mexicana. México; 2017. Available online: http://sig.conanp.gob.mx/website/pagsig/info_shape.htm (accessed on 31 August 2020).
  48. Consejo Nacional de Población (CONAPO). Grado de Marginación por Localidad y Municipio. México; 2019. Available online: https://www.gob.mx/conapo/documentos/indice-de-marginacion-por-localidad (accessed on 31 August 2020).
  49. Secretaría de Desarrollo Social (SEDESOL). México. 2010. Available online: https://www.gob.mx/inea/documentos/secretaria-de-desarrollo-social-164377 (accessed on 1 September 2020).
  50. Doorga, J.R.S.; Gooroochurn, O.; Motah, B.A.; Ramchandur, V.; Sunassee, S. A novel modelling approach to the identification of optimum sites for the placement of ocean thermal energy conversion (OTEC) power plant: Application to the tropical island climate of Mauritius. Int. J. Energy Environ. Eng. 2018, 9, 363–382. [Google Scholar] [CrossRef] [Green Version]
  51. Cahyaningwidi, A. Assessment of Economic Potential of Ocean Thermal Energy Conversion in Indonesia. Master’s Thesis, Delft University of Technology, Delft, The Netherlands, 2018. [Google Scholar]
  52. Secretaría de Marina (SEMAR). San Miguel de Cozumel, Quintana Roo. México; 2012. Available online: https://digaohm.semar.gob.mx/derrotero/cuestionarios/cnarioCozumel.pdf (accessed on 23 February 2021).
  53. Secretaría de Marina (SEMAR). Lázaro Cárdenas, Michoacán. México; 2012. Available online: https://digaohm.semar.gob.mx/cuestionarios/cnarioLazaro.pdf (accessed on 18 February 2021).
  54. Secretaría de Energía (SENER). Metodología, Criterios y Términos para Contratos Legados. 2017. Available online: https://www.gob.mx/cms/uploads/attachment/file/258363/ANEXO_D.pdf (accessed on 20 February 2021).
  55. Gobierno del Estado de Baja California Sur. Información Estratégica. México, Baja California Sur; 2015. Available online: https://www.coneval.org.mx/sitios/RIEF/Documents/Bajacaliforniasur-informacion-estrategica-2015.pdf (accessed on 26 March 2018).
  56. Secretaría de Marina (SEMAR). Cabo San Lucas, Baja California Sur. México; 2012. Available online: http://digaohm.semar.gob.mx/cuestionarios/cnarioCabosnlucas.pdf (accessed on 30 June 2018).
  57. Secretaría de Marina (SEMAR). Puerto ángel, Oaxaca. México; 2012. Available online: https://digaohm.semar.gob.mx/derrotero/cuestionarios/cnarioPtoangel.pdf. (accessed on 30 June 2018).
  58. Cabral, J.; Zanazzi, J. Scikit-Criteria: Colección de métodos de análisis multi-criterio integrado al stack científico de Python. In Proceedings of the XIV Simposio Argentino de Investigación Operativa (SIO 2016)-JAIIO 45; Available online: http://sedici.unlp.edu.ar/handle/10915/58577 (accessed on 30 March 2021).
  59. Rikalovic, A.; Cosic, I.; Lazarevic, D. GIS based multi-criteria analysis for industrial site selection. Procedia Eng. 2014, 69, 1054–1063. [Google Scholar] [CrossRef] [Green Version]
  60. Roy, B.; Słowiński, R. Questions guiding the choice of a multicriteria decision aiding method. EURO J. Decis. Process. 2013, 1, 69–97. [Google Scholar] [CrossRef] [Green Version]
  61. Saaty, T.L. How to make a decision: The analytic hierarchy process. Eur. J. Oper. Res. 1990, 48, 9–26. [Google Scholar] [CrossRef]
  62. Kacprzak, D. An extended TOPSIS method based on ordered fuzzy numbers for group decision making. Artif. Intell. Rev. 2020, 53, 2099–2129. [Google Scholar] [CrossRef] [Green Version]
  63. Krohling, A.; Pacheco, A.G.C. A-TOPSIS—An approach based on TOPSIS for ranking evolutionary algorithms. Procedia Comput. Sci. 2015, 55, 308–317. [Google Scholar] [CrossRef] [Green Version]
  64. Lara-Zúñiga, C.A. Diseño de la protección catódica para los condensadores de las unidades 1 y 2 de la C.T. Plutarco Elías Calles. Tecnolab. XIII. Scielo México 1997, 71, 18–24. [Google Scholar]
  65. Comisión Intersecretarial de Bioseguridad de los Organismos Genéticamente Modificados (CIBIOGEM). Áreas naturales protegidas del Estado de Quintana Roo. Available online: https://www.conacyt.gob.mx/cibiogem/index.php/anpl/quintana-roo (accessed on 18 January 2021).
  66. Heckel, G.; Ruiz-Mar, M.G.; Schramm, Y.; Gorter, U. Atlas de Distribución y Abundancia de Mamíferos Marinos en México; CEMIE-Océano: Campeche, Mexico, 2018. [Google Scholar]
  67. Sands, M.D. Ocean Thermal Energy Conversion (OTEC) Programmatic Environmental Analysis, 1st ed.; U.S Department of Commerce Nacional Oceanic and Atmospheric Administration: Berkeley, CA, USA, 1980. [Google Scholar]
  68. Rivera, G.; Felix, A.; Mendoza, E. A review on environmental and social impacts of thermal gradient and tidal currents energy conversion and application to the case of chiapas, Mexico. Int. J. Environ. Res. Public Health 2020, 17, 7791. [Google Scholar] [CrossRef] [PubMed]
  69. Dulce, O. La SCJN da Fallo Histórico a Favor de los Indígenas de Juchitán y en Contra de Parque Eólico Español; Sin Embargo: Mexico City, Mexico, 2018. [Google Scholar]
  70. Altamirano, C. Se Intensifican las Amenazas Contra Opositores al Gasoducto en Comunidad Yaqui de Sonora, Animal Politico, México, 30-Nov-2018. Available online: https://www.animalpolitico.com/2018/11/amenazas-yaqui-gasoducto-sonora/ (accessed on 11 March 2021).
  71. Hansen, L.; Hammarlund, L.K.; Sorensen, K.; Christensen, H. Public Acceptance of Wave Energy, Proceedings from the 5 European Wave Energy Conference; University College: Dublin, Ireland, 2003. [Google Scholar]
  72. Muralidharan, S. Assessment of Ocean Thermal Energy Conversion. Master’s Thesis, University of Mumbai, Mumbai, India, 2012. [Google Scholar]
  73. Martel, L.; Smith, P.; Rizea, S.; Van Ryzin, J.; Morgan, C.; Noland, G.; Pavlosky, R.; Thomas, M.; Halkyard, J. Ocean Thermal Energy Conversion Life Cycle Cost Assessment; U.S. Department of Energy Office of Scientific and Technical Information: Washington, DC, USA, 2012. [Google Scholar]
  74. Ikegami, Y. The advanced technology and future prospect of OTEC for Island. In IEA Committee on Energy Research and Technology; Saga University: Tokyo, Japan, 2015. [Google Scholar]
  75. García-Huante, A. Posibles Efectos Oceanográficos Por La Operación De Una Planta OTEC (Ocean Thermal Energy Conversion) en La Zona De Puerto Ángel; Universidad Nacional Autónoma de México: Mexico City, México, 2015. [Google Scholar]
  76. Osorio, A.F.; Arias-Gaviria, J.; Devis-Morales, A.; Acevedo, D.; Velasquez, H.I.; Arango-Aramburo, S. Beyond electricity: The potential of ocean thermal energy and ocean technology ecoparks in small tropical islands. Energy Policy 2016, 98, 713–724. [Google Scholar] [CrossRef]
Figure 1. Study area divided into regions in MP and CS (modified from Chiapa-Carrara et al., 2019 [27]).
Energies 14 02121 g001
Figure 2. Selection of comparative criteria for DM.
Energies 14 02121 g002
Figure 3. Electricity consumption by sector, 5 years (data from the Energy Information System, SIE [25]).
Energies 14 02121 g003
Figure 4. Methodology for the selection of optimal sites.
Energies 14 02121 g004
Figure 5. Theoretical net power off Mexico (in MW) for a 50 MW-CC design and a sixteen-year period.
Energies 14 02121 g005
Figure 6. Level of risk associated with Tropical Cyclones in coastal municipalities.
Energies 14 02121 g006
Figure 7. Environmental criteria and Marginalization Index in potential sites.
Energies 14 02121 g007
Figure 8. Comparison of (a) LREC and (b) LMP for the potential sites.
Energies 14 02121 g008
Figure 9. LCOE vs. CF for different types of power plants.
Energies 14 02121 g009
Table 1. Regions of the Mexican Pacific (MP) ocean.
RegionsCoastal StatesMain CharacteristicsRef.
(NP) Northwestern Pacific and (GC) Gulf of CaliforniaBaja California and
Baja California Sur
The ocean circulation is influenced by the California Current, where the 300 m surface layer has velocities of ~0.3–0.4 m s−1, temperatures between 12 °C ≤ SST < 18 °C and salinities >34.5 ups. The mean depth estimated for the euphotic zone is 39 m. The differences between the SST and the temperature at a depth of 1000 m is around 18 °C.[27,28,29]
(CMP) Central MPJalisco, Colima,
Michoacan, Guerrero and part of Oaxaca
The region is affected by the Ekman transport, the anticyclonic circulation of the Tehuantepec Bowl, the Costa Rica Coastal Current and West Mexican Current. It is generally covered by the Eastern Pacific Warm Pool, where the SST is warmer than 28.5 °C throughout the year. The temperature differences are between 22 °C and 24 °C. The euphotic zone is >25 m year-round.[27,28,30]
(SMP) Southern MPOaxaca and ChiapasComprises the Gulf of Tehuantepec, is strongly influenced by northerly winds, called “Tehuanos”, that produce sea surface mixing, giving a thermocline upwelling bringing SST anomalies. Thermal differences are over 26 °C, and the euphotic zone is 48 m[27,28,31]
Table 2. The level of importance high (H), medium (M) and low (L) of the potential sites.
SitesThermal PowerEnergy
Need
Energy CostExtreme EventsTourist
Activity
Industrial
Activity
CozumelHMHHHM
Lazaro CardenasMLLMMH
Cabo San LucasLMMHHM
Puerto AngelHHML M L
Table 3. Locations, distances to cold water intake, and temperature differences at potential sites.
Sites1 Latitude
(°)
1 Longitude
(°)
2 Latitude
(°)
2 Longitude
(°)
Distance to Cold Water Intake (km) T m  
Cozumel20.52−86.9420.25−86.935.429.07
Lazaro Cardenas17.96−102.1917.78−102.0621.929.52
Cabo San Lucas22.89−109.9222.83−109.917.528.62
Puerto
Angel
15.67−96.4915.63−96.473.929.41
1 Locality, 2 OTEC floating plants.
Table 4. Average daily persistence (p) over a 16-year period of net power (%).
Floating Sites<10.010.0–12.4912.5–24.925.0–49.9≥50.0
Cozumel0000100%
Lazaro Cardenas0000100%
Cabo San Lucas32%0026%42%
Puerto Angel0000100%
Table 5. Distance to the electricity grid, theoretical net production by OTEC and the % coverage of electricity consumption of the states in which the sites are.
SitesStatesDistance to the Electricity Grid (km)OTEC Production (GWh/yr)% of the State´s Energy Consumption
CozumelQuintana Roo44402.969%
Lazaro CardenasMichoacan32402.966%
Cabo San LucasBaja California Sur7105.952%
Puerto AngelOaxaca13402.9616%
Table 6. Socioeconomic criteria for the sites.
SitePopulation Number of Households % of Homes without
Electricity
Cozumel86,41518,5790.22
Lazaro Cardenas183,18544,9730.43
Cabo San Lucas81,11118,8290.63
Puerto Angel26456753.28
Table 7. Weighting of the Multi-Criteria Decision Analysis.
CriteriaType (min/max)Weighing
Distance to cold-water intake at 1000 m depth (km) min0.18
Temperature difference (°C)max0.23
Power availability (%)max0.23
Extreme eventsmin0.08
Protected areasmin0.08
Marginalization index max0.05
Home without electricity (%) max0.05
Local marginal price (USD/MWh) max0.05
Distance to the electricity grid (km) min0.04
nmax = 10.09, CI = 0.14, CR = 0.09
Notes: nmax is an eigenvalue of the DM; CI is the consistency index and CR is the consistency ratio.
Table 8. Ranking of sites for OTEC installation using the TOPSIS method.
AlternativesRanking
Cozumel3
Lazaro Cardenas4
Cabo San Lucas2
Puerto Angel1
Publisher’s Note: MDPI stays neutral with regard to jurisdictional claims in published maps and institutional affiliations.

