1. Introduction
Marine waves, currents and tides, saline and thermal gradients can all be harnessed to generate sustainable energy. Oceanic thermal energy conversion (OTEC) is how thermal gradient energy generation is possible. This uses the differences in temperature between the surface of the sea and deeper waters to generate electrical energy, using a thermodynamic Rankine cycle. Technically speaking, OTEC power can be divided into three types: closed-cycle (the working fluid is conserved, pumped back to the evaporator after condensation), open cycle (the working fluid is vented after use, as water vapor) and hybrid cycle (a combination of the previous two systems) [
1,
2].
A stable, strong thermal stratification of the water column is required [
1] to achieve an efficient yield [
3,
4], and a minimum temperature difference of 20 °C is needed. These requirements generally limit the areas where OTEC technology is possible to intertropical zones. However, there are some plants in extra-tropical regions, such as Goseong, South Korea, which work with differences of less than 18 °C [
5,
6].
The temporal resolution of the ocean-temperature time-series is important for analyzing the OTEC’s performance: the higher the spatial and temporal resolution, the better the description of the behavior of the variable. In addition, the duration of the time-series should be long enough to include seasonal trends and, perhaps even other established multiyear trends [
7]. More and better technologies for temperature measurement would help this [
8].
Currently, there are several databases with information on world oceanic parameters (including the Sea Surface Temperature, SST). The problem is selecting the database, which best computes electrical power for a specific purpose and scale to optimize the computational capabilities and time spent.
There are conditions that are favorable for the operation of the OTEC system in the Mexican Pacific Ocean. This extends from 14°3′ N to 32°3′ N and 92°23′ W 117°8′ W, encompassing the Gulf of California (GC) and the upwelling regions off the coasts of Baja California, Jalisco and Colima and Oaxaca. The annual variation of surface temperature fluctuates between 26 °C and 30 °C [
9]. The intrusion of Subtropical Surface Water causes annual changes of 5 °C or more in the area near Cabo Corrientes, while in the Gulf of Tehuantepec, they oscillate between 3 °C and 4 °C. The warm waters of the Tropical Pacific are subject to superficial heating, which induces convection, and thus gives a constant mixing process and a mixing layer with a vertical extension of 20 to 50 m. The thermocline separating the layers is shallow and permanent [
10].
This work presents a comparison of three databases: World Ocean Atlas (WOA), Satellite Oceanic Monitoring System (SATMO) and in situ measurements of sea surface temperature and uses statistical correlation. The databases differ in the means of measurement (satellite and in situ), as well as in their temporal and spatial resolutions. In conclusion, the authors define which of these types of information is most appropriate for determining areas suited to the implementation of OTEC plants in Mexico.
2. Materials and Methods
2.1. Data
For this study, the oceanographic data were divided into: (1) in situ data, (2) satellite data from SATMO, and (3) Interpolated data from WOA. Details of each are given below.
2.1.1. In Situ Data
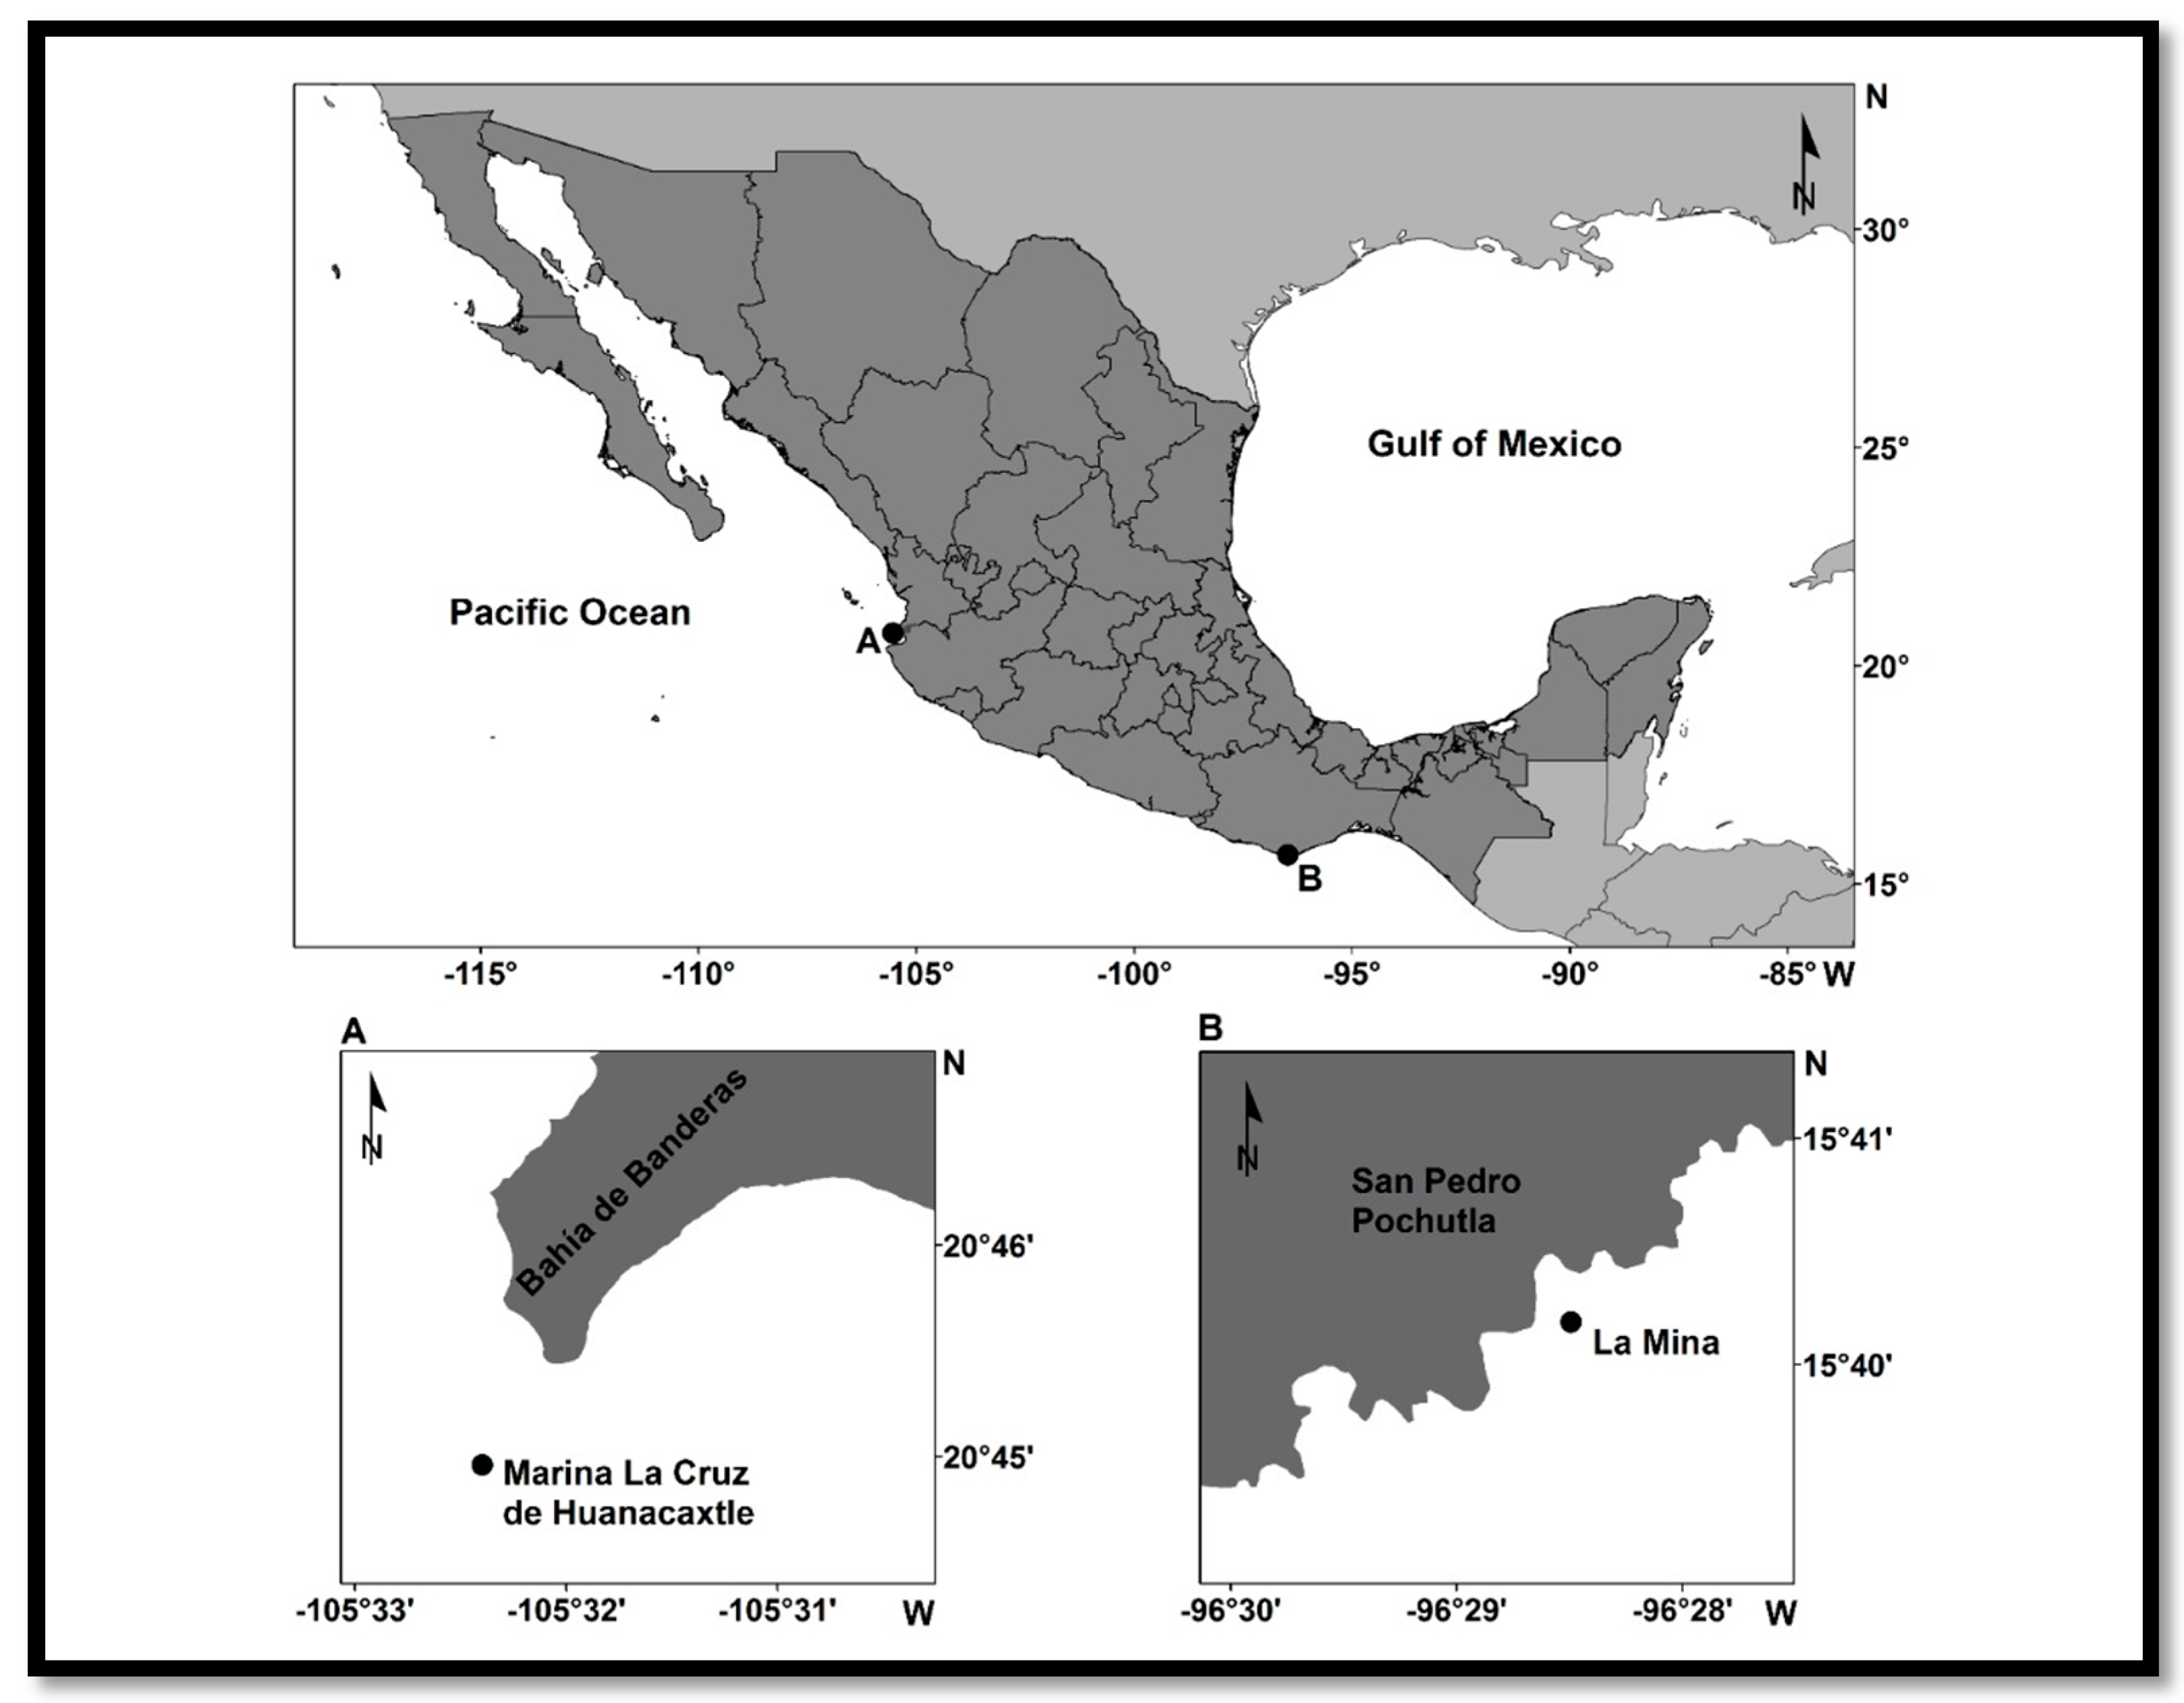
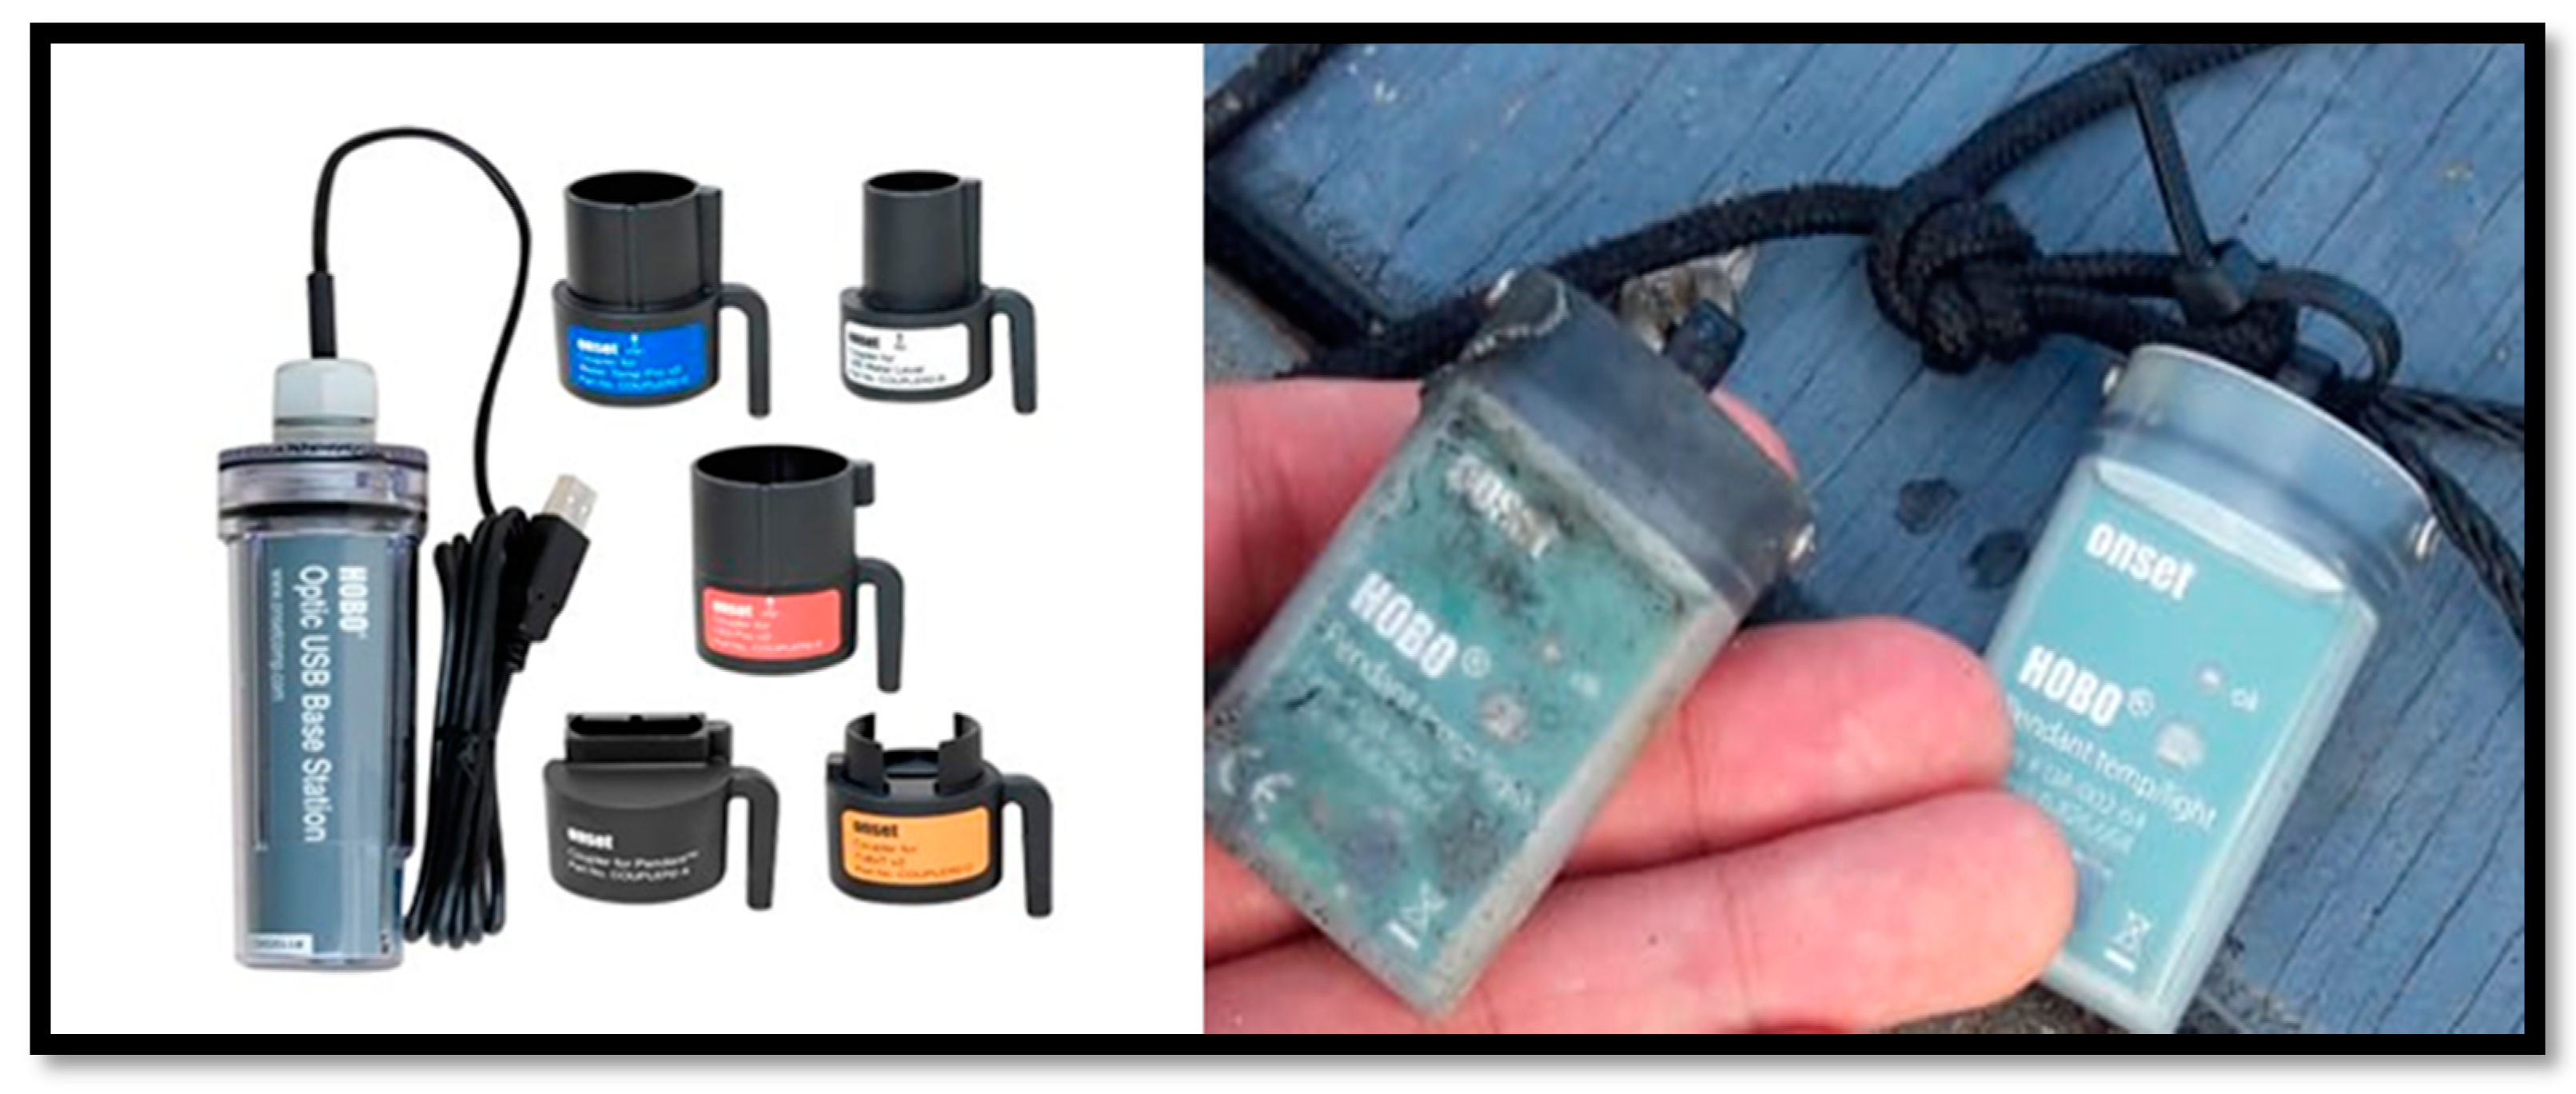
The in situ data comes from HOBO Water Temp Pro v2 data loggers, placed in Marina La Cruz de Huanacaxtle, Nayarit and La Mina, Puerto Angel, Oaxaca. The map was made using ArcGIS software v. 10.4 (
Figure 1). This type of logger measures temperatures between −40 °C and 70 °C (−40 °F to 158 °F) in the air, and up to 50 °C (122 °F) in water [
9]. The temperatures can be recorded from −20 °C to 70 °C (−4 °F to 158 °F) and the light from 0 to 320,000 lux (0 to 30,000 lumens ft
−2). The HOBO has an accuracy range for a temperature of ± 0.53 °C from 0° to 50 °C (±0.95 °F from 32 °F to 122 °F), and a resolution of the temperature of 0.14 °C at 25 °C (0.25 °F at 255 °F), and drift of less than 0.1 °C per year (0.2 °F year
−1) [
11] (
Figure 2).
The measurements were taken over one year (April 2017 to April 2018) at Marina La Cruz de Huanacaxtle and over six months (May to October 2018) at La Mina (Puerto Angel), as shown in
Table 1. The data analysis only includes nighttime sea surface temperature (NSST) data to avoid errors caused by luminosity and other reflective and incidence processes of solar radiation directly over the sensor of the thermistor and to have comparable data.
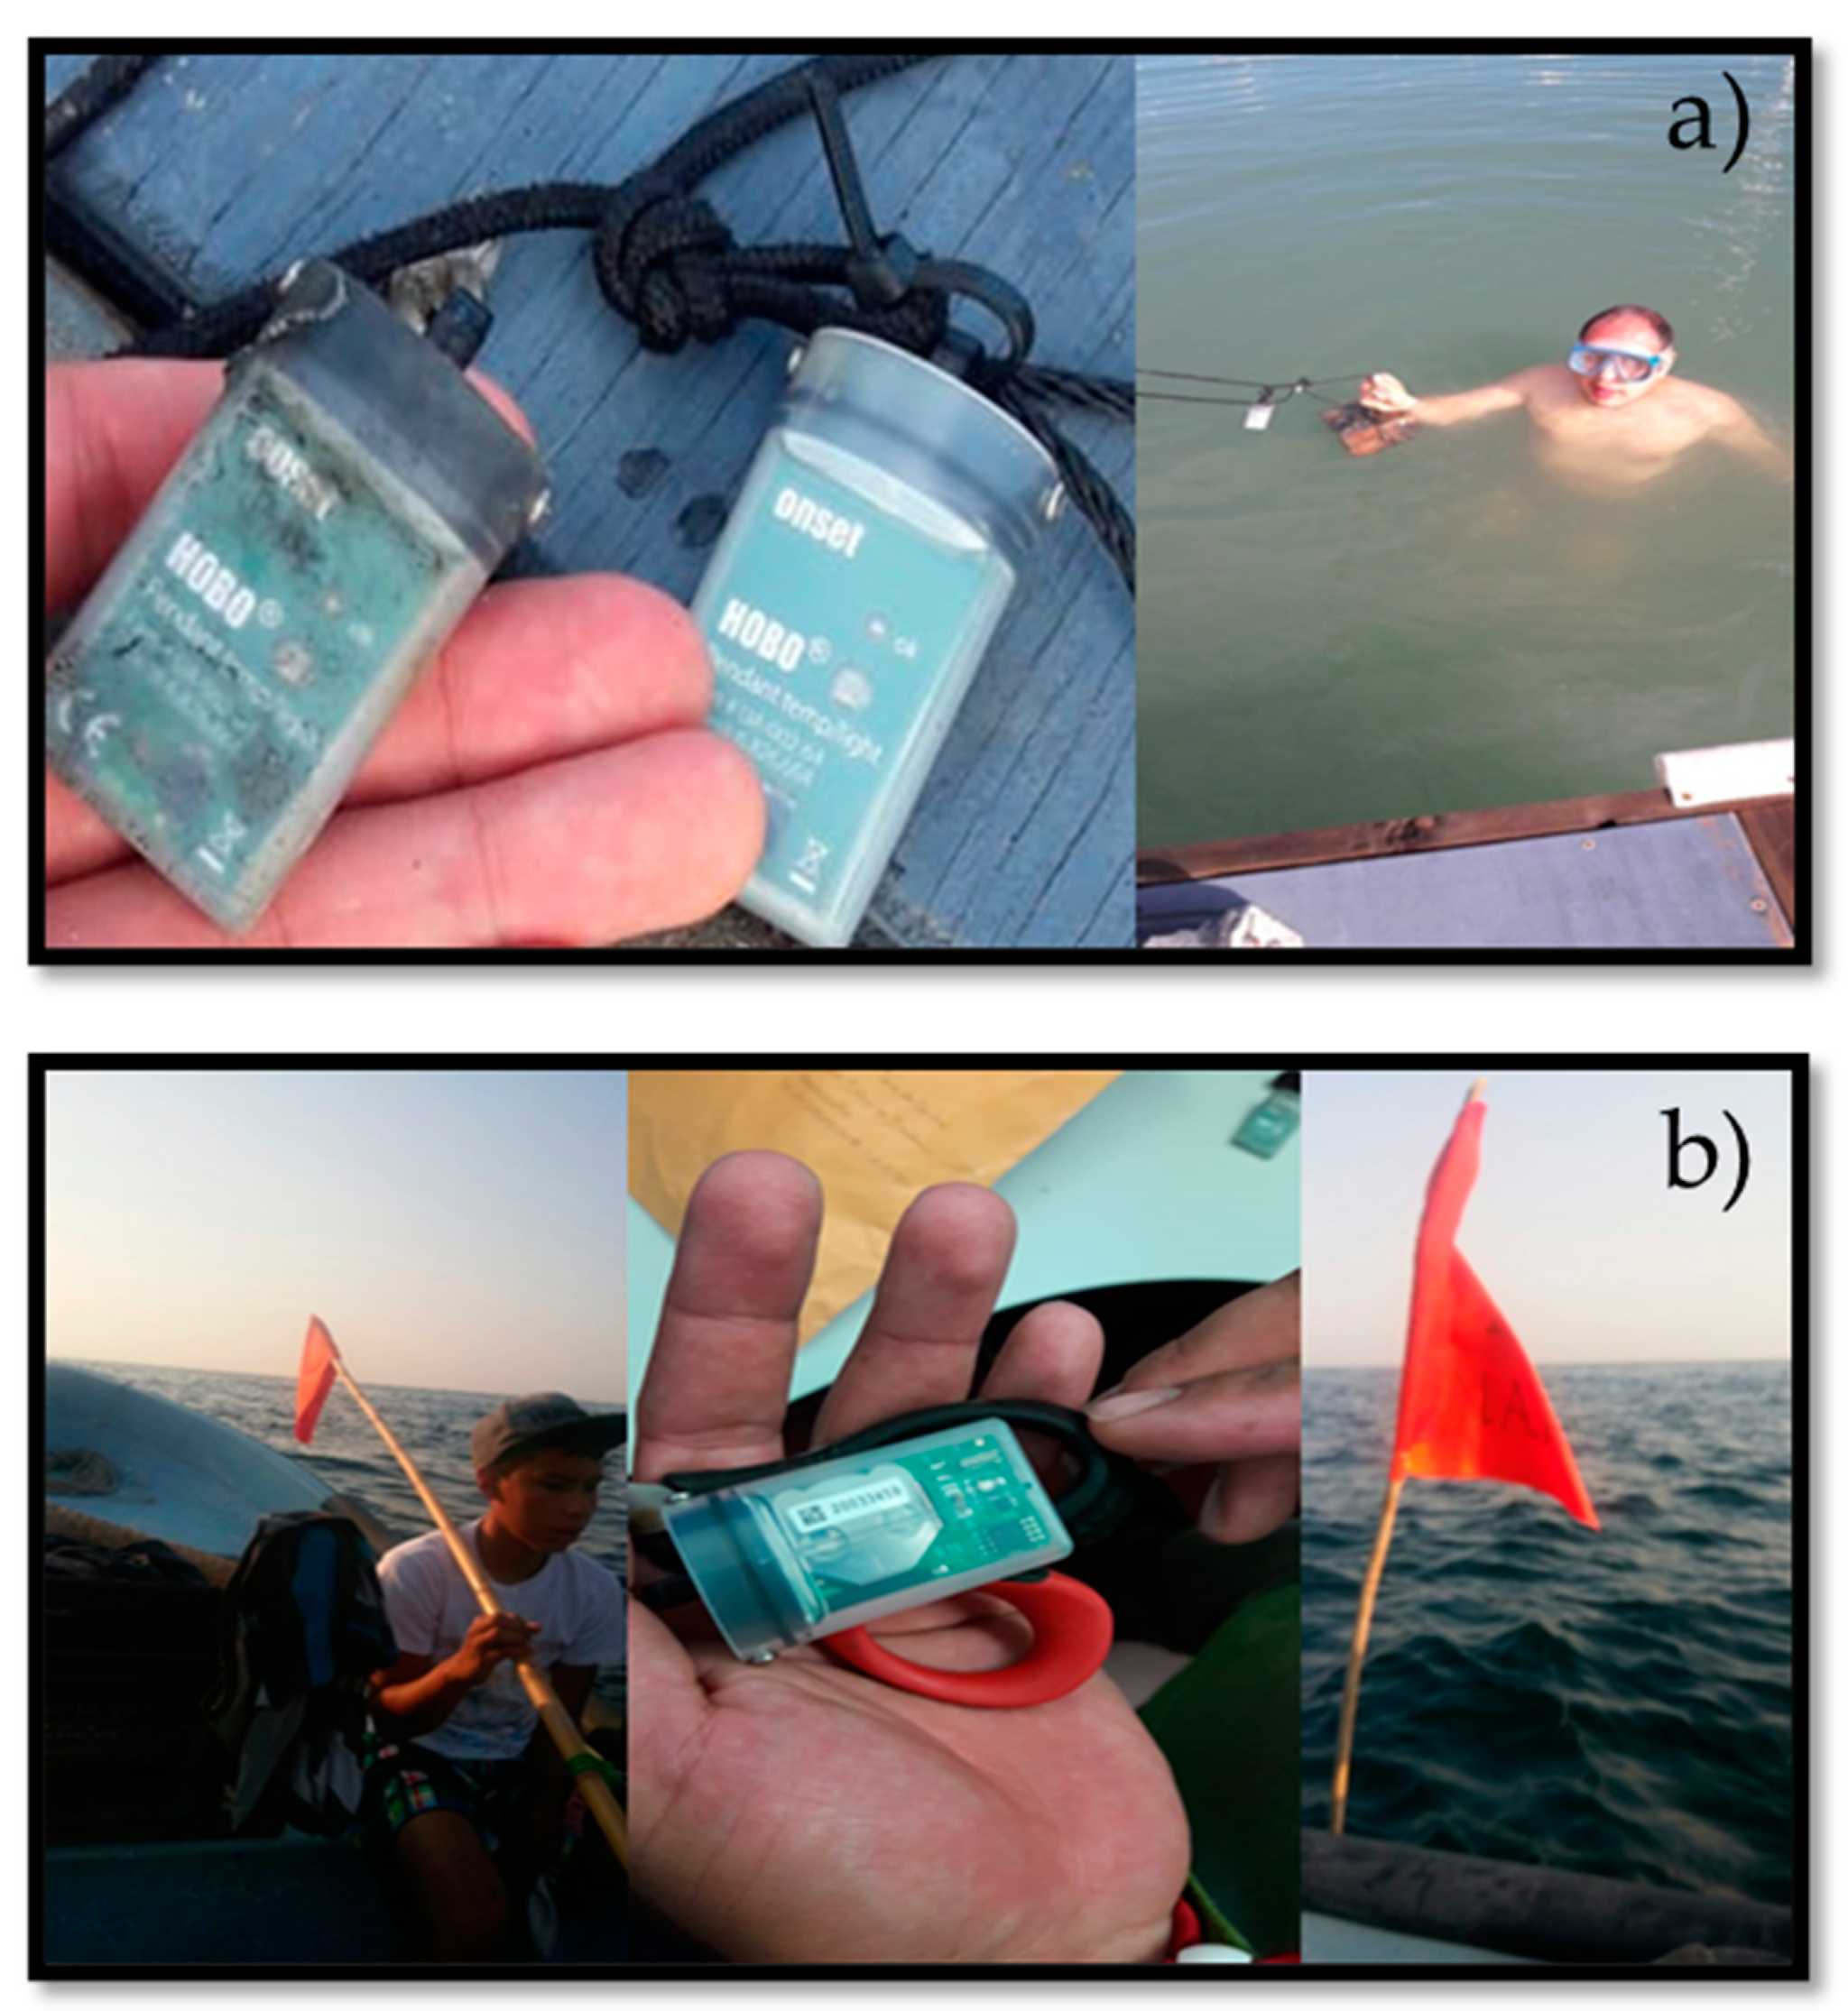
Figure 3 shows the colocation of the thermistors in these sites.
Sensors were placed at depths of more than 1 m for several months, and they agree very well with the surface satellite data. The data were taken every 10 min, which allows statistical management and is greater than the response time. Once the thermistor data were obtained, comparisons were made with the databases [
11].
2.1.2. Satellite Data
The Satellite Oceanic Monitoring System (SATMO) is part of the Marine Ecosystem Information and Analysis System of Mexico (SIMAR) developed by the National Commission for the Knowledge and Use of Biodiversity (CONABIO).
NSST data, with a spatial resolution of 1 to 5 km (0.01°–0.05°) and a temporal resolution of one day, were used from June 2002 to August 2018 (16 years). The data were divided into two reanalysis models called OSTIA and GHRSST-MUR [
12]. These data were used to obtain a statistical comparison with the data from the thermistors and establish whether the satellites contained surface temperature data from the study sites.
The first of the reanalyzes (OSTIA) is based on field data from ICOADS, AVHRR Pathfinder and the along-track scanning radiometer (ATSR) multi-emission series, with a spatial resolution of 5 km (0.05°) and daily temporal coverage of 1 January 1985 to 31 May 2002. The optimal interpolation was made at multiple scales, and the data were filtered to avoid diurnal variability. The diurnal data cut was made based on the sunrise–sunset time of the two sites, on average, between 6:45 or 7:45 am until 6:45 or 7:45 pm (depending on the time zone on that date).
The second reanalysis (GHRSST-MUR) works with retrospective sea surface temperature data (of 4 days) and in near real time (of one day) from 1 June 2002 to the last night–day recorded. It is based on interpolation optimized for a 0.01° grid over nighttime sea surface temperature observations from the following satellite sensors: NASA Advanced Microwave Scanning Radiometer-EOS (AMSR-E) from NASA’s Aqua satellite, Moderate Resolution Imaging Spectroradiometer (MODIS) on NASA’s Aqua and Terra satellites, US Navy Microwave WindSat Radiometer on Coriolis satellite, Advanced Very High Resolution Radiometer (AVHRR-3) on NOAA-18 satellite, and in situ observations of sea temperatures derived from the NOAA iQuam Project.
2.1.3. Interpolated Data
For the World Ocean Atlas (WOA), SST data to 0 m depth (daytime and nighttime) were taken at monthly, seasonal and annual temporal resolutions. The spatial resolutions of the WOA are 1° (~100 km) and ¼° (~25 km). The temporal coverage usually groups the data into periods of 9 years, from 1955 to 2017. The database contains objectively analyzed climatology, statistical mean, standard deviation and number of observations [
13].
2.2. Methodology
Statistical Analysis
Initially, comparisons of the SST data were made by plotting the SST of each group graphically in order to see its behavior, as shown in
Table 2. Once the comparisons were made, the corresponding statistical analysis was performed.
According to Díaz-Agero [
14], correlation or dependence is any statistical relationship, whether causal or not, between two random variables or bivariate data. In the broadest sense, correlation is any statistical association, though it commonly refers to the degree to which a pair of variables are linearly related. Correlations are useful because they can indicate a predictive relationship that in practice can be made use of.
Essentially, correlation is the measure of how two or more variables are related to one another. There are several correlation coefficients, often denoted as ρ (rho) or r, which measure the degree of correlation. The most common of these is the Pearson’s correlation coefficient, which is sensitive only to a linear relationship between two variables (which may be present even when one variable is a nonlinear function of the other). Other correlation coefficients—such as Spearman’s rank correlation—have been developed to be more robust than Pearson’s, that is, more sensitive to nonlinear relationships. Mutual information can also be applied to measure dependence between WOA, SATMO and in situ databases.
Due to the above, a normality test [
15] to the temperature data determined the correct statistical method to apply during correlation. Finally, the results determined that the Spearman “rho” correlation [
16] test was used for multiple correlation analysis. Spearman’s correlation coefficient (ρ) is a measure of the correlation (the association or interdependence) between two random variables (both continuous and discrete). To calculate ρ, the data are ordered and replaced by their respective order.
The Spearman’s correlation coefficient, ρ, is given by the expression:
where
D is the difference between the corresponding statistics of the order of x-y.
N is the number of data pairs. The existence of identical data must be considered when ordering them, although if these are few, they can be ignored.
The interpretation of Spearman’s coefficient is the same as that of Pearson’s correlation coefficient. It oscillates between −1 and +1, indicating negative or positive associations, respectively, 0 zero, which means no correlation but no independence. Kendall’s tau is a rank correlation coefficient, inversions between two orders of a bivariate normal distribution.
The statistical parameters for the three databases were also calculated. The three groups of data were correlated against each other, as shown in
Table 3, to estimate the difference between the values of SST. The SATMO and in situ data give daily data, while WOA has annual, seasonal and monthly data, so the temporary cycle is different for each case.
3. Results
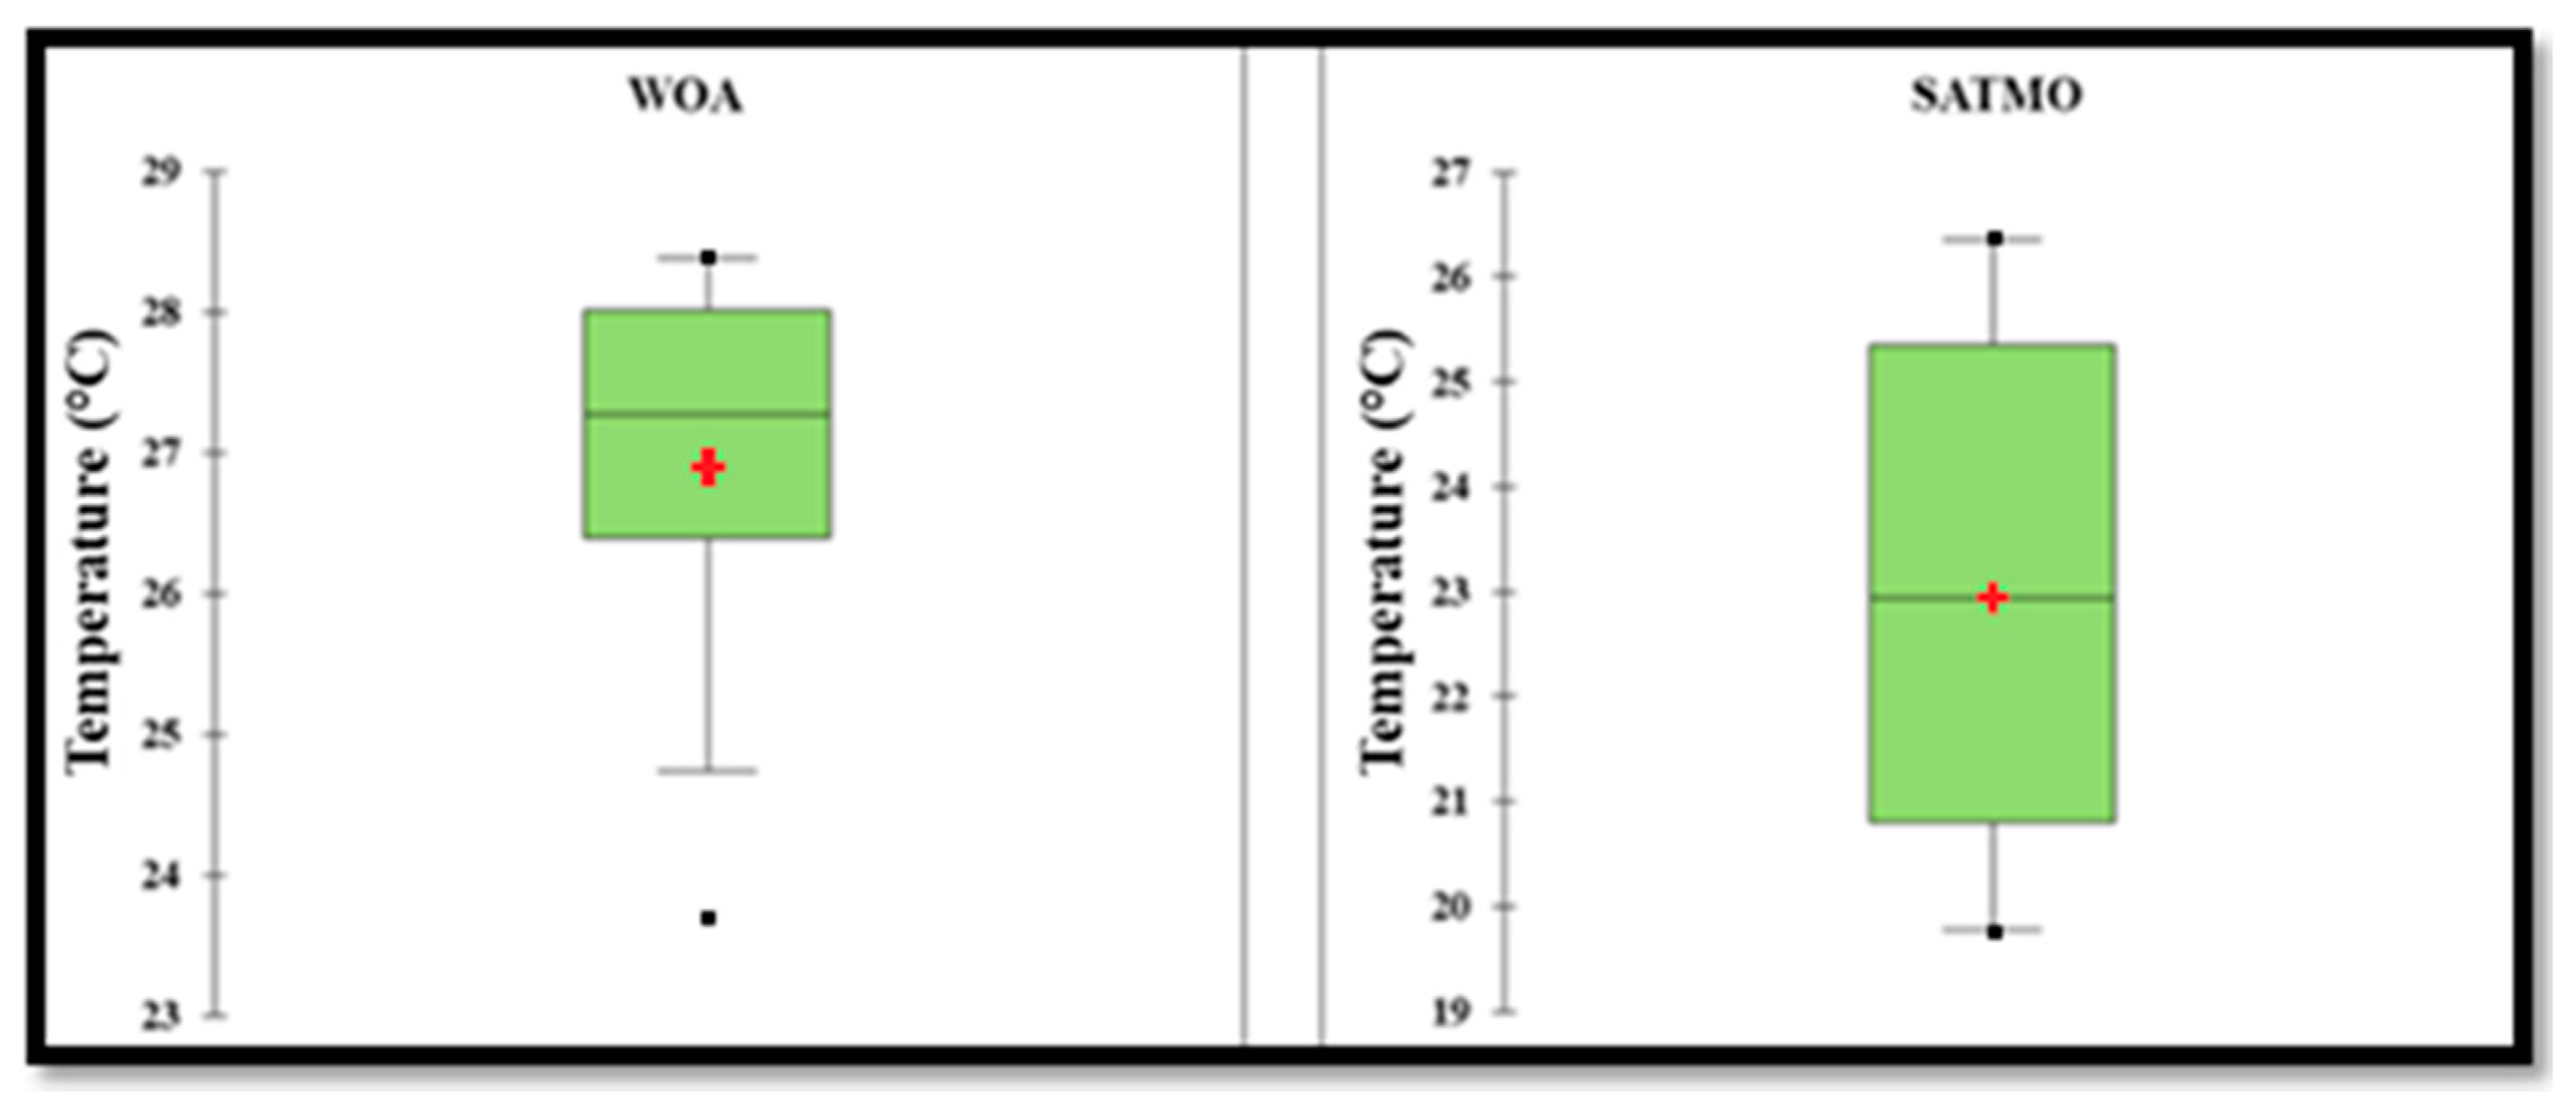
The mean values were 26.902 °C for the WOA database and 22.936 °C for the SATMO database. The minimum values for monthly average sea-surface temperature from 2002 to 2017 were 23.686 °C for WOA and 19.778 °C for SATMO, recorded in January and February, respectively. The maximum value of this variable is 28.386 °C for WOA and 26.347 °C for SATMO, for August and September, respectively. The corresponding boxplots are shown in
Figure 5.
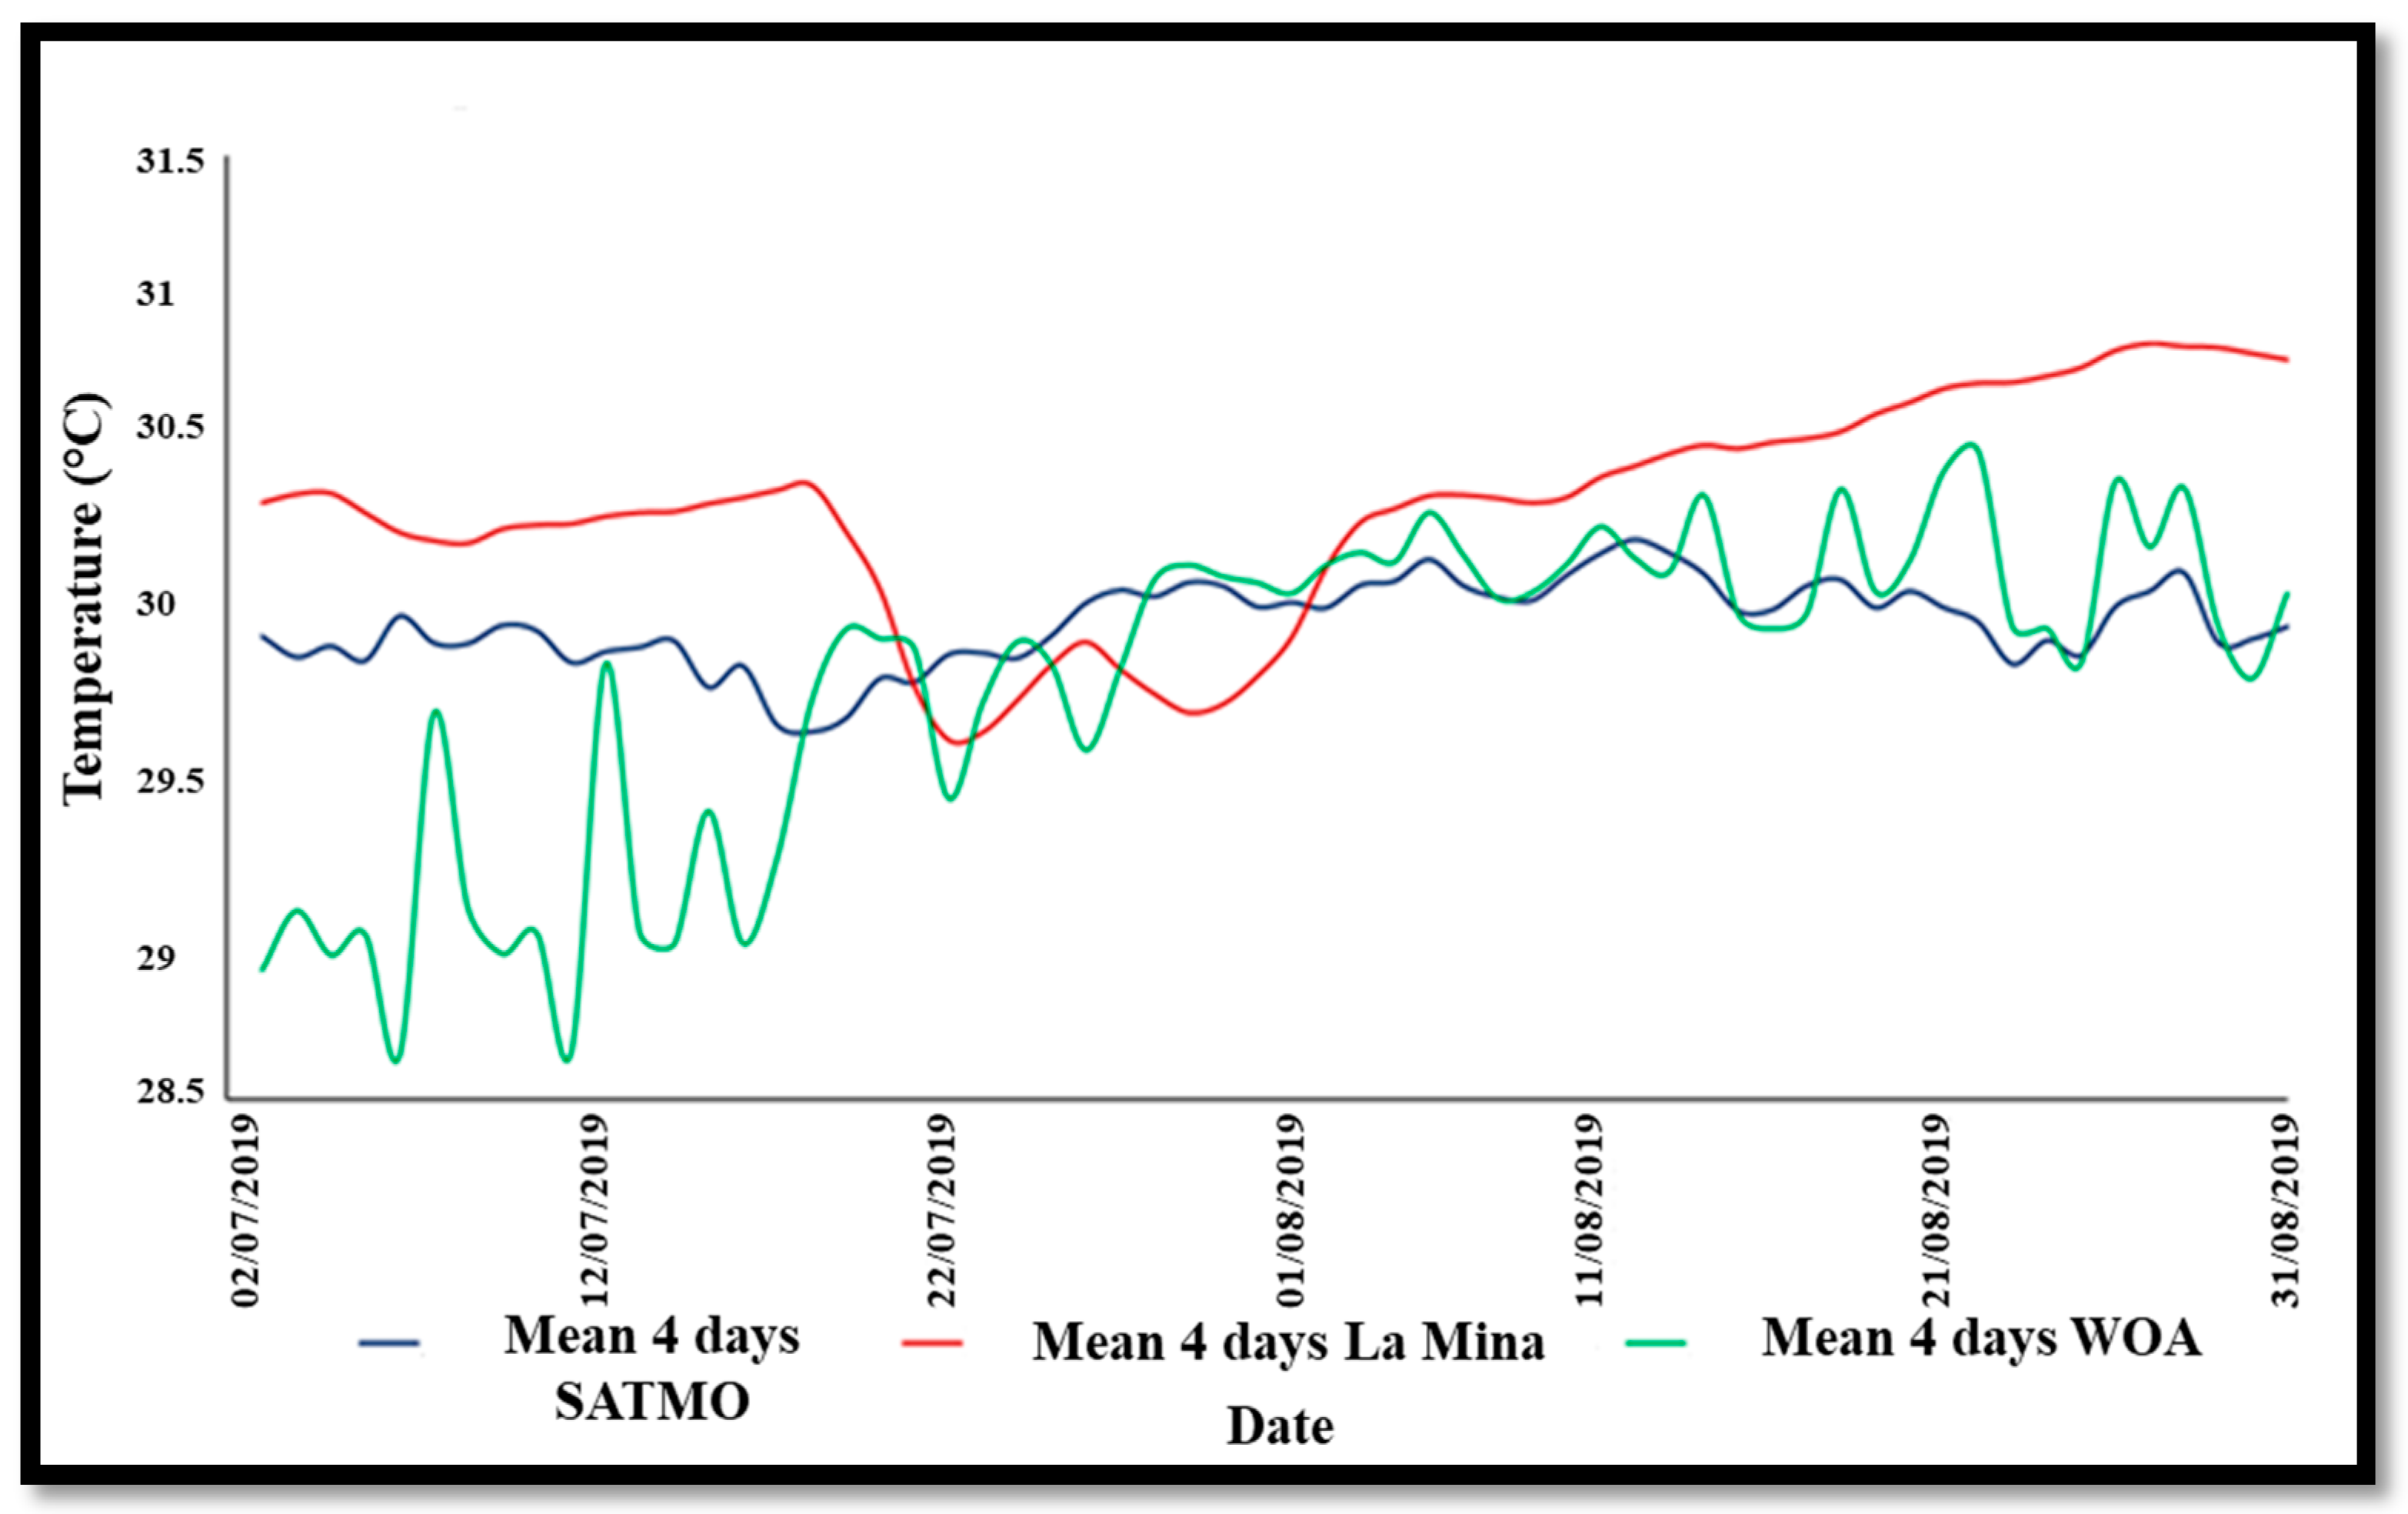
The comparison of data for 4-day averages for SATMO, WOA and in situ records for La Mina is shown in
Figure 6 and
Table 5.
The minimum temperatures for SATMO and in situ databases are very similar, both corresponding to July. For the SATMO database, the minimum occurred between July 16 and 19, while for in situ databases, the maximum occurred between July 20 and 23. The WOA minimum temperature was 28.64 °C, recorded between July 4 and 7.
The maximum values range from 30 to 31 °C for all the databases. The SATMO maximum occurred between August 9 and 12, the in situ maximum between August 24 and 27, and the WOA maximum was recorded between August 19 and 22.
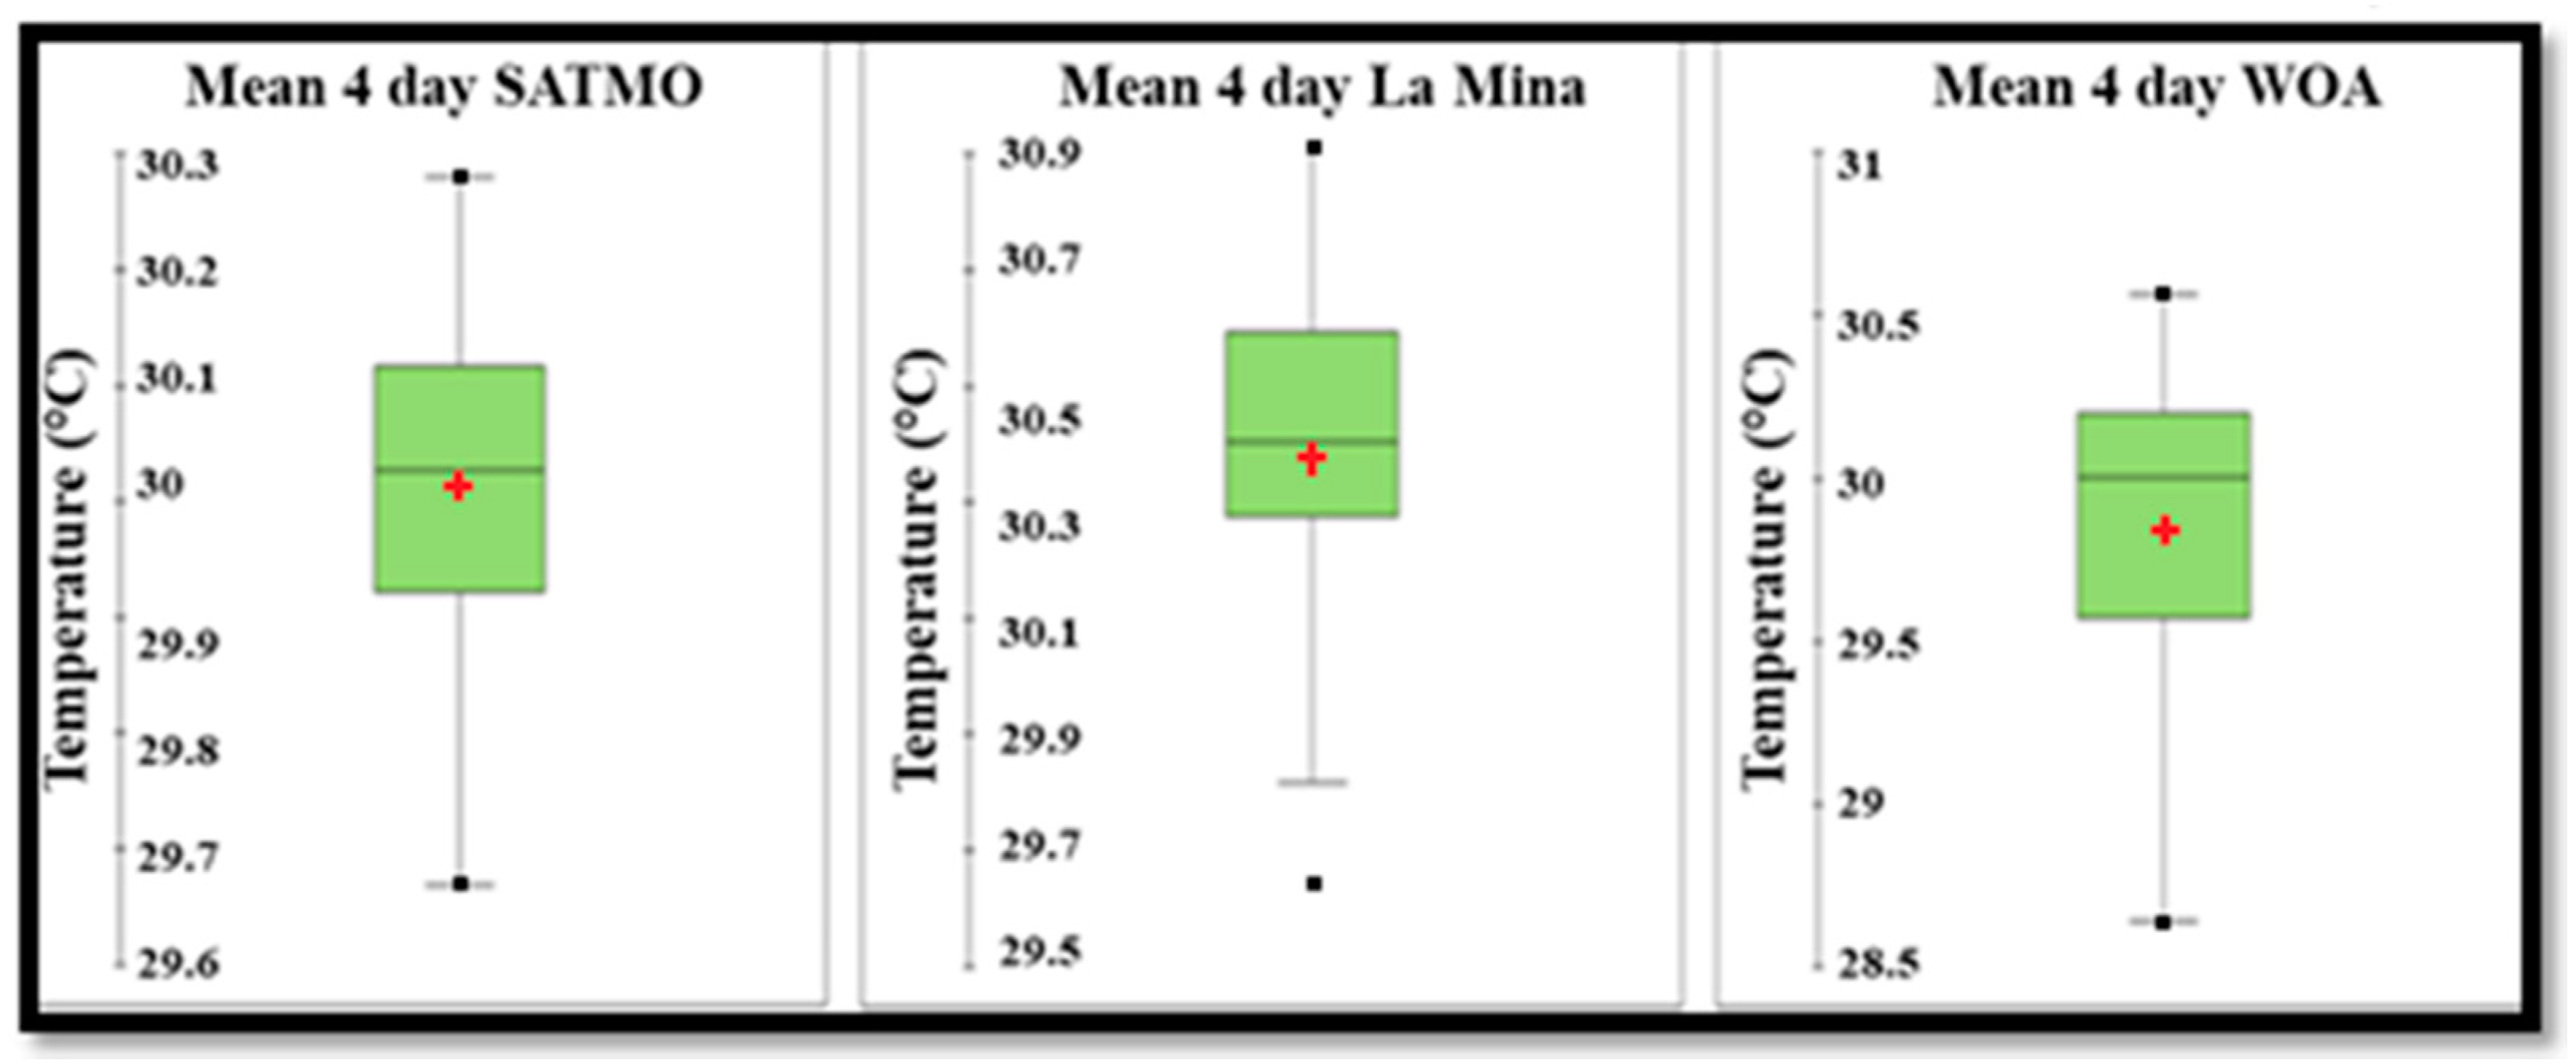
Figure 7 shows the descriptive statistics for the three databases.
The mean values in
Table 5 show an increase in SST corresponding to the increase in the spatial resolution of the data. The lowest value corresponds to WOA, with a 0.25° spatial resolution, while the highest value corresponds to in situ data.
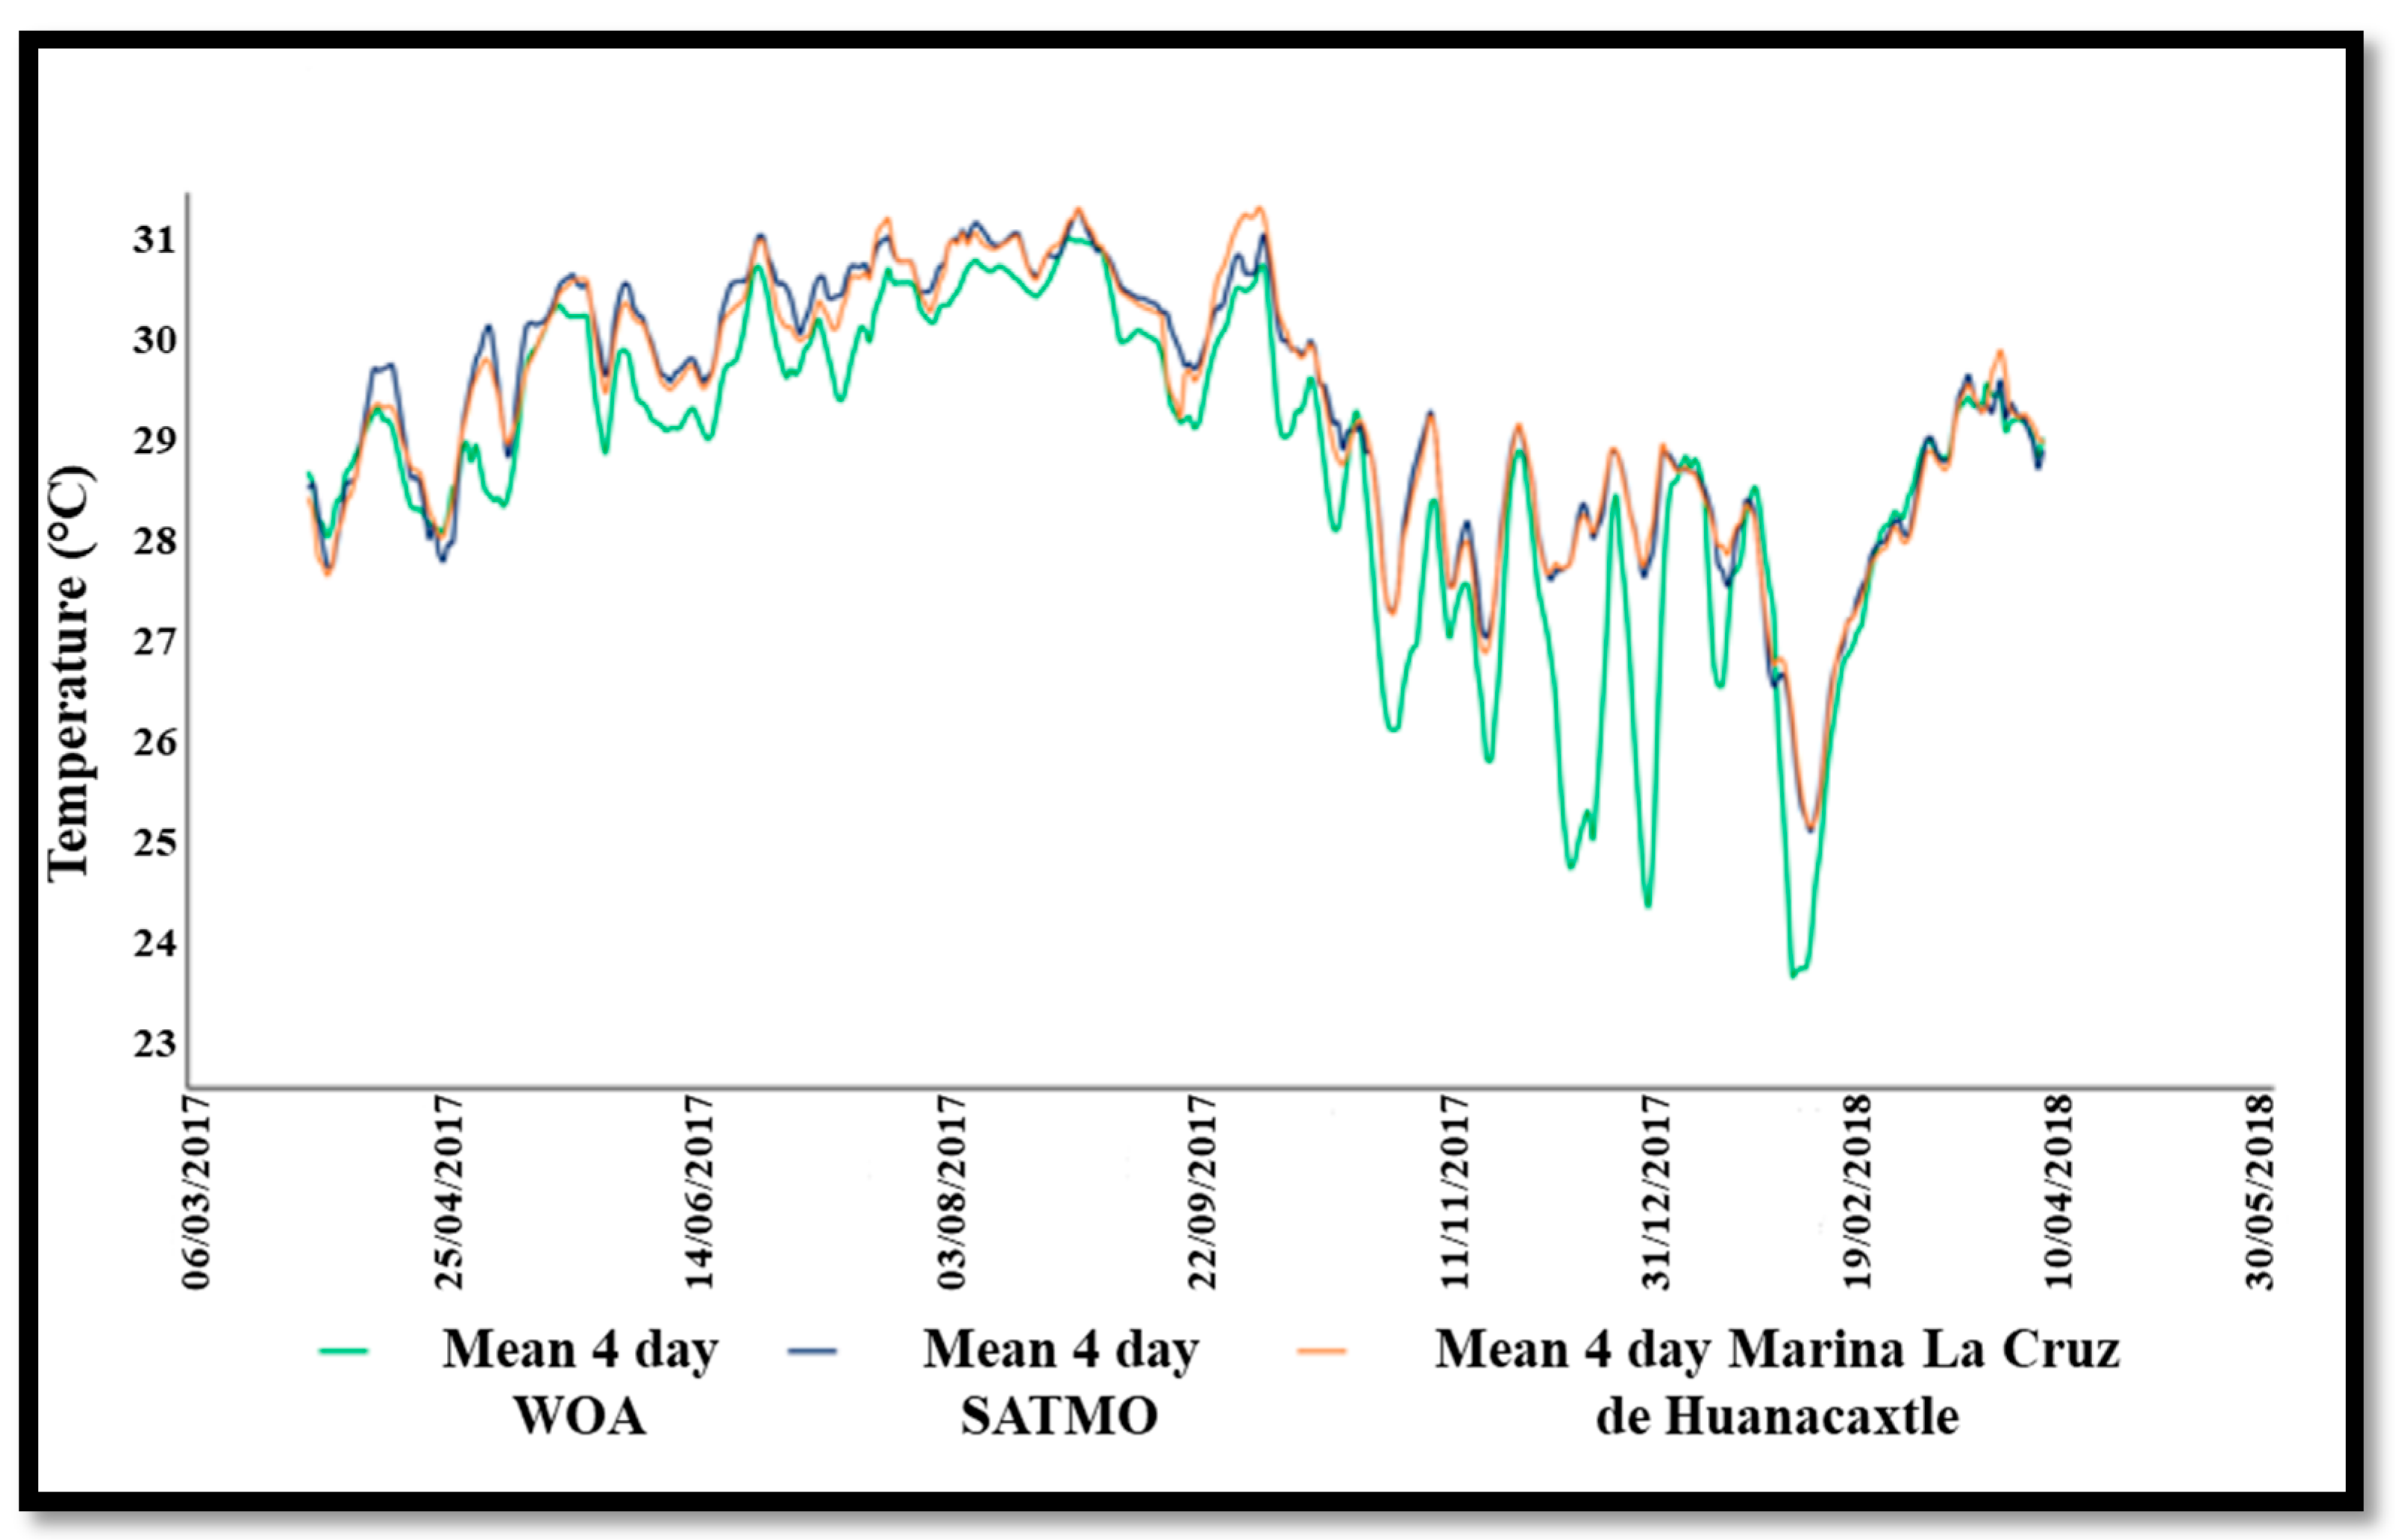
In the case of Marina La Cruz de Huanacaxtle,
Figure 8 shows the comparison of data and
Table 6 shows the descriptive statistics.
The three databases give similar tendencies. The maximum values correspond to September for WOA and SATMO and to October for the in situ database. The minimum values were 24 °C for WOA, 25.2 °C for Satmo and 25.3 °C for the in situ data. In this case, unlike that of La Mina, the mean values do not increase as spatial resolution decreases since the minimum value corresponds to the maximum spatial resolution. However, the maximum values do not correspond to the minimum spatial resolution (in situ).
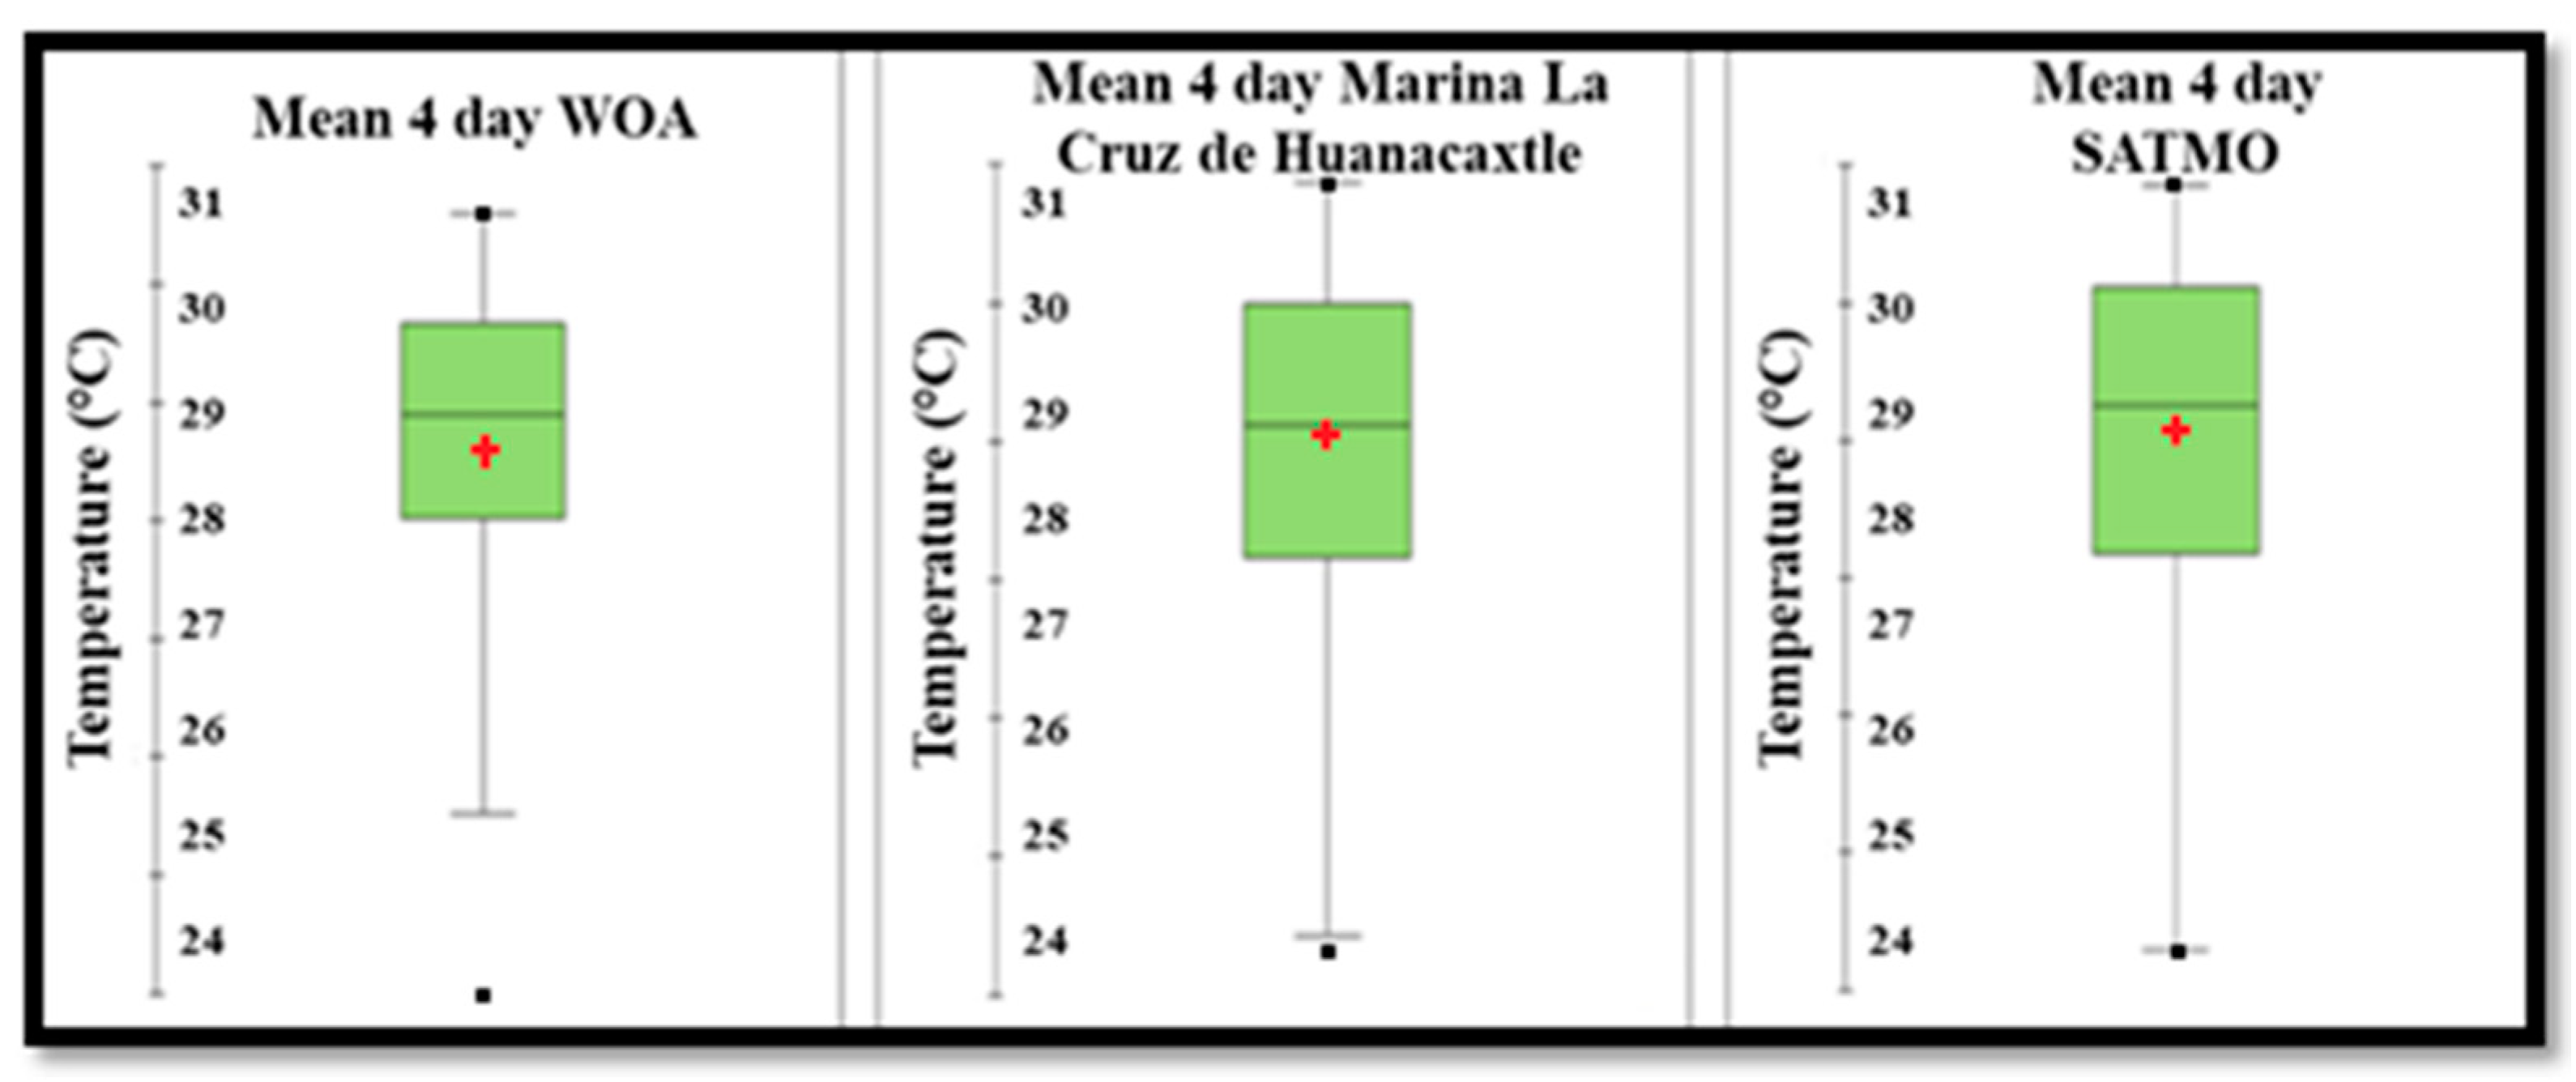
The standard deviation is very similar (1 °C) for the three databases, so changes in the temperature data are less variable. The mean values were 28.592, 29.071 and 29.046 °C for WOA, SATMO, and in situ, respectively.
Table 7 shows the results of a normality test for the three databases. Where the computed probability is higher than the significance level, the data distribution is said to be normal. The WOA and SATMO databases show this normal distribution, but the in situ database does not, except for La Mina, in the Jarque–Bera analysis.
Therefore, a no-parametric multiple correlation analysis “rho” Spearman was made. This correlation was used to determine whether a correlation exists between the databases.
Table 8 shows the results.
The results indicate that, according to rho-Spearman, all the databases have a significant correlation. For the SATMO vs. WOA and the SATMO/WOA vs. Marina Cruz de Huanacaxtle, the correlation is very high (between 0.95 and 0.97), while for the SATMO/WOA vs. La Mina, the correlation is very low, and for the WOA, it is negative.
4. Discussion
The power delivered by OTEC plants is affected by sea surface temperature changes; therefore, it is important to use databases with high temporal resolution [
17]. The daily frequency of the SATMO database is adequate for design purposes of an OTEC plant; however, in situ measurements with a temporal resolution of about one hour are necessary for the convenient operation of an OTEC plant.
A comparison of the monthly average of the WOA and SATMO databases shows a high correlation. However, differences exist in some descriptive parameters, such as the mean, standard deviation, minimum and maximum values. These differences are because the databases do not have the same spatial and temporal resolution, and the methods for measuring the values are different; the WOA uses interpolation methods from in situ data, while the SATMO only uses satellite image data [
18]. This could produce direct changes in the values of the data; for example, in a database with a higher spatial resolution, certain oceanographic processes modifying the sea-surface temperature would not be detected, and the result of the interpolation would be coarser due to the smaller amount of field or satellite data, of the resolution [
19]. Another effect of the differences in resolution between the databases, which directly influences the surface temperature, is the detection of thermal phenomena in small areas. These cannot be identified using the WOA, with a 25–100 km resolution, but can be detected with the SATMO (1–5 km resolution). The databases with a lower interpolation resolution show some oceanographic processes that are relevant for the operation of an OTEC [
19].
The comparison between the databases and the in situ data from La Mina shows similar trends for both time series. However, oceanographic processes are detected with the in situ data from the thermistors that are not observed with the WOA and SATMO database resolutions.
While the in situ data have values of less than 29 °C in June and July 2018, the databases cannot show values of less than 30 °C. This means that phenomena such as upwelling cannot be detected by the databases. These phenomena are of the utmost importance in the operation of an OTEC plant and in the identification of the optimum temperature gradients to produce electrical energy. As thermal differences generate electrical power values for the OTEC cycle, having more precise data would allow us to better evaluate the operation of the cycle [
7]. It should also be noted that at times when the temperature measured by the thermistor increases, the SATMO measurement is lower, and vice versa. In addition, the WOA data do not consider certain oceanographic processes, such as upwelling, river discharges and the effects of hurricanes on sea-surface temperature, which are taken into account by the thermistor.
Comparison of the databases and the in situ data from Marina La Cruz de Huanacaxtle (
Figure 4 and
Figure 5) also shows differences similar to those explained above. However, in the case of SATMO, the satellite data are available in the mesh covering the whole of Bahía de Banderas. As a result, the behavior of the SST of the SATMO is very similar to that of the thermistors.
In conclusion, to identify large-scale zones with potential for OTEC plant installation, it is much better to use databases with greater resolution, combined with field data. The SST values will then be more accurate, and so the forecasts for electrical power calculations will be better. In other words, to evaluate specific areas, the SATMO database is more reliable than the WOA along with the thermistor measurements. For a more general, regional or exclusive economic zone evaluation, either database can be used [
20,
21].
For the three databases analyzed, the multiple correlation factor (rho) is very high, between 0.95 and 0.99. For the comparison between SATMO and WOA, the result is very close to 1 because the two bases are calibrated with practically the same in situ data, using the same satellites. However, the main difference is in the spatial resolution. Therefore, any database is suitable to determine general regions for OTEC plants but not for specific sites, especially if electric power evaluation is required. In this case, daily, or even hourly, data must be used since there are oceanographic processes that can alter the thermal differentials in the upper part of the water column that only lasts for a short time.
Between the in situ, SATMO and WOA databases, there are significant differences, although correlation exists. For WOA and SATMO, in respect to Marina La Cruz de Huanacaxtle, the correlation is very high (0.95 and 0.99, respectively) as in situ data are used to calibrate the satellite data.
The correlation of in situ measurements at La Mina with SATMO and WOA is low since the area covered by the satellite data does not include the site where the logger was located. The interpolation of the WOA database does not include local oceanographic phenomena, which directly affects the values of surface temperature.
5. Conclusions
The operational performance of an OTEC plant depends largely on the quality of temporal and spatial in situ or remote sensing measurements. That is why having databases with the high temporal and spatial resolution is very important when evaluating potential sites for plants that use the thermal difference of the ocean water column to produce electrical energy.
It can be concluded that the in situ and SATMO databases are better for selecting specific areas or sites for electricity generation using OTEC technology. In addition, managing daily or hourly data offers better control and operationalization of the plant, as well as giving an approximation of the real net power that can be generated. On the other hand, with the WOA database, it is possible to determine extensive regions suitable for OTEC technology.
Finally, while the SST data from all the databases compared correlates well, the selection of the best database depends on the objectives of the installation and on the operation of the plant.
Author Contributions
Conceptualization, A.G.H. and R.S.; methodology, A.G.H., E.P.G.R. and Y.R.C.; software, Y.R.C. and E.P.G.R.; validation, M.Á.A.M.; formal analysis, A.G.H., Y.R.C. and R.E.H.C.; investigation, A.G.H., Y.R.C., E.P.G.R. and R.E.H.C., statistical analysis, A.G.H.; writing—original draft preparation, A.G.H., Y.R.C. and R.S.; writing—review and editing, A.G.H., M.Á.A.M., Y.R.C. and R.S. All authors have read and agreed to the published version of the manuscript.
Funding
This research was funded by the CONACYT-SENER-Sustentabilidad Energética project: FSE-2014-06-249795 Centro Mexicano de Innovación en Energía del Océano (CEMIE-Océano).
Institutional Review Board Statement
Not applicable.
Informed Consent Statement
Not applicable.
Data Availability Statement
Data sharing not applicable. No new data were created or analyzed in this study. Data sharing is not applicable to this article.
Acknowledgments
We would like to thank Sergio Cerdeira Estrada and Raúl Martell Dubois of the National Commission for the Knowledge and Use of Biodiversity (CONABIO) for helping us to understand the operation of the SATMO database. Víctor Luna Gómez, M. in Phil. Alonso Pérez Pérez of Instituto de Ciencias del Mar y Limnología UNAM, Leonora Fernanda Mondragón Sánchez and members of the Regional Fishing Research Center (CRIP) Bahía de Banderas for their support in the placement of thermistors in Bahía de Banderas. Cristino García Ramírez, Emiliano García Ramírez and Fis. Mat. Marcos García Trujillo for their support in collocating the thermistors in Puerto Angel. Finally, the authors are grateful to the Centro Mexicano de Innovación en Energía del Océano (CEMIE-Océano) funded by the CONACYT-SENER Sustentabilidad Energética project: FSE-2014-06-249795.
Conflicts of Interest
The authors declare no conflict of interest.
Abbreviations
| OTEC | Ocean thermal energy conversion |
| WOA | World Ocean Atlas |
| SATMO | Satellite Oceanic Monitoring System |
| GC | Gulf of California |
| SST | Sea surface temperature |
| NSST | Nighttime sea surface temperature |
| SIMAR | Marine Ecosystem Information and Analysis System of Mexico |
| CONABIO | National Commission for the Knowledge and Use of Biodiversity |
| ATSR | Along track scanning radiometer |
| AMSR-E | NASA Advanced Microwave Scanning Radiometer-EOS |
| MODIS | Moderate Resolution Imaging Spectroradiometer |
| AVHRR-3 | Advanced Very High-Resolution Radiometer |
References
- Avery, W.H.; Wu, C. Renewable Energy from the Ocean-A Guide to OTEC, Johns Hopkins University Applied Physics Laboratory Series in Science and Engineering; Apel, J.R., Ed.; Oxford University Press: New York, NY, USA, 1994; p. 446. [Google Scholar]
- Vega, L.A. First generation 50 MW OTEC plantship for the production of electricity and desalinated water. In Offshore Technology Conference; OTC: Houston, TX, USA, 2010; pp. 1–17. [Google Scholar]
- d’Arsonval, A. Utilisation des Forces Naturelles. Avenir de l’ Electricite. Rev. Sci. 1881, 17, 370–372. Available online: http://gallica.bnf.fr/ark:/12148/bpt6k215097r (accessed on 16 July 2020). (In French).
- Claude, G. Power from the Tropical Seas. Mech. Eng. 1930, 52, 1039–1044. [Google Scholar]
- García Huante, A. Posibles Efectos Oceanográficos por la Operación de una Planta OTEC en Puerto Ángel, Oaxaca, México. Master’s Thesis, Posgrado en Ciencias del Mary Limnología, Universidad Nacional Autónoma de México, Ciudad de México, México, 2015; p. 113. [Google Scholar]
- Lee, H.S.; Lee, S.W.; Kim, H.J.; Jung, Y.K. Performance Characteristics of 20 kW Ocean Thermal Energy Conversion Pilot Plant. In Proceedings of the ASME 2015 9th International Conference on Energy Sustainability ES2015, San Diego, CA, USA, 28 June–2 July 2015; p. 6. [Google Scholar]
- Rajagopalan, K.; Nihous, G.C. Estimates of Global Ocean Thermal Energy Conversion (OTEC) Resources Using an Ocean General Circulation Model. Renew. Energy 2013, 50, 532–540. [Google Scholar] [CrossRef]
- Nihous, G.C. An Order-Of-Magnitude Estimate of Ocean Thermal Energy Conversion Resources. ASME J. Energy Res. Technol. 2005, 127, 328–333. [Google Scholar] [CrossRef] [Green Version]
- Fiedler, P.C.; Talley, L.D. Hydrography of the eastern tropical Pacific: A review. Prog. Oceanogr. 2006, 69, 143–180. [Google Scholar] [CrossRef]
- Lara-Lara, J.R.; Arreola-Lizárraga, J.A.; Calderón-Aguilera, L.E.; Camacho-Ibar, V.F.; de la Lanza-Espino, G.; Escofet-Giansone, A.; Zertuche-González, J.A. Los Ecosistemas Marinos, en Capital Natural de México, Vol. I: Conocimiento Actual de la Biodiversidad; CONABIO: Ciudad de México, México, 2008; pp. 135–159. [Google Scholar]
- OnSet HOBO Data Logger Manual. 2016. Available online: www.onsetcomp.com (accessed on 29 May 2019).
- Cerdeira-Estrada, S.; Martell-Dubois, R.; Valdéz Chavarin, J.; Rosique-de la Cruz, L.; Perera-valderrama, S.; López-perea, J.; Caballero-Aragón, H.Y.; Ressl, R. Sistema Satelital de Monitoreo Oceánico-Satellite-Based Ocean Monitoring System (SATMO), en Sistema de Información y Análisis Marino Costero (SIMAR); CONABIO: Ciudad de México, México, 2018–2020. [Google Scholar]
- Locarnini, R.A.; Mishonov, A.V.; Antonov, J.I.; Boyer, T.P.; Garcia, H.E.; Baranova, O.K.; Zweng, M.M.; Paver, C.R.; Reagan, J.R.; Johnson, D.R.; et al. World Ocean Atlas 2017, Volume 1: Temperature; Levitus, S., Technical Mishonov, A., Eds.; NOAA Atlas NESDIS 73 Publisher: Washington, DC, USA, 2013; p. 40.
- Díaz-Agero. Indicadores Sintéticos. 1999. Available online: http//festadisticas.fguam.es/indicadores/iae.html (accessed on 12 June 2019).
- Addison Co. XLSTAT for Excel. Paris, France. 2017. Available online: www.xlstat.com (accessed on 20 February 2019).
- Kenney, J.F.; Keeping, E.S. Mathematics of Statistics, Part 2, 2nd ed.; Van Nostrand: Princeton, NJ, USA, 1951; p. 344. [Google Scholar]
- Nihous, G.C. A Preliminary Assessment of Ocean Thermal Energy Conversion (OTEC) Resources. ASME J. Energy Res. Technol. 2007, 129, 10–17. [Google Scholar] [CrossRef] [Green Version]
- Cerdeira-Estrada, S.; Martell-Dubois, R.; Valdéz, J.; Ressl, R. Satellite-Based Ocean Monitoring System (SATMO). In Information & Analysis System of Marine Ecosystem of Mexico (SIMAR); CONABIO: Ciudad de Meéxico, México, 2018; Available online: https://simar.conabio.gob.mx (accessed on 15 March 2019).
- Chalkiadakis, C. OTEC Resource Potential Mapping. A Spatial Assessment Including State of the Art Practicable Criteria by Using Geo-Information Systems (GIS). Master’s Thesis, Facultad de Manejo y Política Tecnológica, Universidad Tecnológica de Delft, Delft, The Netherlands, 2007; p. 137. [Google Scholar]
- Huante, A.G.; Cueto, Y.R.; Ruiz, E.P.G.; Contreras, R.E.H. General Criteria for Optimal Site Selection for the Installation of Ocean Thermal Energy Conversion (OTEC) Plants in the Mexican Pacific; IntechOpen: London, UK, 2020. [Google Scholar] [CrossRef]
- Rivera, G.; Felix, A.; Mendoza, E. Ocean Thermal Energy Conversion (OTEC)-Past, Present, and Progress. Graciela Rivera, Angélica Felix, Edgar Mendoza. A Review on Environmental and Social Impacts of Thermal Gradient and Tidal Currents Energy Conversion and Application to the Case of Chiapas, Mexico. Int. J. Environ. Res. Public Health 2020, 17, 7791. [Google Scholar] [CrossRef]
Figure 1.
Study areas on the Pacific coast: (A) Marina La Cruz de Huanacaxtle and (B) La Mina. The black points show where the thermistors were placed.
Figure 1.
Study areas on the Pacific coast: (A) Marina La Cruz de Huanacaxtle and (B) La Mina. The black points show where the thermistors were placed.
Figure 2.
HOBO Water Temp Pro v2 with data loggers.
Figure 2.
HOBO Water Temp Pro v2 with data loggers.
Figure 3.
Colocation of the thermistors in (a) Marina Cruz de Huanacaxtle and (b) La Mina.
Figure 3.
Colocation of the thermistors in (a) Marina Cruz de Huanacaxtle and (b) La Mina.
Figure 4.
Comparison of the average monthly SST data, 2002–2017, for two databases for the Mexican Pacific Ocean.
Figure 4.
Comparison of the average monthly SST data, 2002–2017, for two databases for the Mexican Pacific Ocean.
Figure 5.
Mean and standard deviation values for World Ocean Atlas (WOA) and Satellite Oceanic Monitoring System (SATMO) databases. The cross indicates the statistical mean, while the dots indicate the minimum and maximum values.
Figure 5.
Mean and standard deviation values for World Ocean Atlas (WOA) and Satellite Oceanic Monitoring System (SATMO) databases. The cross indicates the statistical mean, while the dots indicate the minimum and maximum values.
Figure 6.
Comparison of the 4-day averaged data for the three databases, SATMO, WOA and in situ at La Mina.
Figure 6.
Comparison of the 4-day averaged data for the three databases, SATMO, WOA and in situ at La Mina.
Figure 7.
Mean and standard deviation for SATMO, WOA and in situ measurements at La Mina. The cross indicates the statistical mean, while the dots indicate the minimum and maximum values.
Figure 7.
Mean and standard deviation for SATMO, WOA and in situ measurements at La Mina. The cross indicates the statistical mean, while the dots indicate the minimum and maximum values.
Figure 8.
Comparison of the monthly average 4 days of in situ data from Marina La Cruz de Huanacaxtle, SATMO and WOA.
Figure 8.
Comparison of the monthly average 4 days of in situ data from Marina La Cruz de Huanacaxtle, SATMO and WOA.
Figure 9.
Mean and standard deviations for SATMO, WOA and Marina La Cruz de Huanacaxtle databases. The cross indicates the statistical mean, while the dots indicate the minimum and maximum values.
Figure 9.
Mean and standard deviations for SATMO, WOA and Marina La Cruz de Huanacaxtle databases. The cross indicates the statistical mean, while the dots indicate the minimum and maximum values.
Table 1.
Measurement of surface and deeper water (SST) in situ.
Table 1.
Measurement of surface and deeper water (SST) in situ.
| Site | Time Interval | Temporary Cycle | Depth |
|---|
| La Mina | 10 min | 6 months | 1–5 m |
| Marina La Cruz de Huanacaxtle | 10 min | 1 year | 4 m |
Table 2.
Characteristics of the SST data for each comparison.
Table 2.
Characteristics of the SST data for each comparison.
| Database | Site | Data Type | Temporary Cycle | Period |
|---|
| SATMO/in situ/WOA | Marina La Cruz de Nahuacaxtle/
La Mina | NSST (average of four days) | Annual/four months | 2017–2018/2018 (June–September) |
| SATMO/WOA | Mexican Pacific | Average Monthly surface temperature | Multiannual | 2002–2017 |
Table 3.
Simple linear correlation of databases and in situ data.
Table 3.
Simple linear correlation of databases and in situ data.
| Correlated Database | Data Type | Temporary Cycle |
|---|
| SATMO-in situ | NSST | Daily |
| SATMO-WOA | Average monthly surface temperature | Monthly |
| WOA-in situ | Average monthly surface temperature | Monthly |
Table 4.
Representative statistical data for WOA and SATMO databases.
Table 4.
Representative statistical data for WOA and SATMO databases.
| Parameter | WOA | SATMO |
|---|
| Observations | 12 | 12 |
| Minimum | 23.686 | 19.778 |
| Maximum | 28.386 | 26.347 |
| 1st Quantile | 26.403 | 20.793 |
| Median | 27.280 | 22.934 |
| 3rd Quantile | 28.011 | 25.347 |
| Mean | 26.902 | 22.936 |
| Variance (n − 1) | 2.133 | 6.192 |
| Standard deviation (n − 1) | 1.461 | 2.488 |
Table 5.
Descriptive statistics for SATMO, WOA and in situ at La Mina.
Table 5.
Descriptive statistics for SATMO, WOA and in situ at La Mina.
| Parameter | Mean 4 Day SATMO | Mean 4 Day La Mina | Mean 4 Day WOA |
|---|
| Observations | 60 | 60 | 60 |
| Minimum | 29.669 | 29.645 | 28.640 |
| Maximum | 30.280 | 30.904 | 30.563 |
| 1st Quantile | 29.922 | 30.276 | 29.573 |
| Median | 30.027 | 30.406 | 30.001 |
| 3rd Quantile | 30.117 | 30.594 | 30.200 |
| Mean | 30.014 | 30.376 | 29.840 |
| Variance (n − 1) | 0.018 | 0.119 | 0.266 |
| Standard deviation (n − 1) | 0.134 | 0.346 | 0.516 |
Table 6.
Parameters of the descriptive statistics.
Table 6.
Parameters of the descriptive statistics.
| Parameter | WOA | SATMO | Marina La Cruz de Huanacaxtle |
|---|
| Observations | 375 | 375 | 375 |
| Minimum | 24 | 25.292 | 25.337 |
| Maximum | 31 | 30.852 | 30.873 |
| 1st Quantile | 28.013 | 28.181 | 28.163 |
| Median | 28.900 | 29.261 | 29.123 |
| 3rd Quantile | 29.675 | 30.117 | 29.994 |
| Mean | 28.592 | 29.071 | 29.046 |
| Variance (n − 1) | 2.045 | 1.378 | 1.354 |
| Standard deviation (n − 1) | 1.430 | 1.174 | 1.163 |
Table 7.
Test of normality for the SATMO, WOA and in situ databases.
Table 7.
Test of normality for the SATMO, WOA and in situ databases.
| Variable | Shapiro–Wilk | Anderson–Darling | Lilliefors | Jarque–Bera |
|---|
| WOA | 0.086 | 0.122 | 0.535 | 0.330 |
| SATMO | 0.166 | 0.264 | 0.488 | 0.558 |
| La Mina | 0.003 | 0.001 | 0.002 | 0.19 |
| Marina La Cruz de Huanacaxtle | <0.0001 | <0.0001 | <0.0001 | <0.0001 |
Table 8.
Values of the multiple correlation factor (rho) for the three databases analyzed.
Table 8.
Values of the multiple correlation factor (rho) for the three databases analyzed.
| Correlated Data Sources | rho-Spearman | Data Type | p-Spearman | α |
|---|
| SATMO vs. WOA | 0.9790 | Monthly average | <0.0001 | 0.05 |
| SATMO vs. La Mina | 0.004 | 4-Day average | 0.9780 | 0.05 |
| WOA vs. La Mina | −0.085 | Monthly average | 0.5070 | 0.05 |
| SATMO vs. Marina La Cruz de Huanacaxtle | 0.9900 | 4-Day average | <0.0001 | 0.05 |
| WOA vs. Marina La Cruz de Huanacaxtle | 0.9590 | Monthly average | <0.0001 | 0.05 |
| Publisher’s Note: MDPI stays neutral with regard to jurisdictional claims in published maps and institutional affiliations. |
© 2021 by the authors. Licensee MDPI, Basel, Switzerland. This article is an open access article distributed under the terms and conditions of the Creative Commons Attribution (CC BY) license (http://creativecommons.org/licenses/by/4.0/).


 ,
, 


