Article

Wave Energy Resource Harnessing Assessment in a Subtropical Coastal Region of the Pacific

by
Emiliano Gorr-Pozzi
1,
Héctor García-Nava
1,*,
Marco Larrañaga
2,
Melissa G. Jaramillo-Torres
1 and
Manuel G. Verduzco-Zapata
3
1
Instituto de Investigaciones Oceanológicas, Universidad Autónoma de Baja California, Carretera Ensenada-Tijuana No. 3917, Fraccionamiento Playitas, Ensenada 22860, Baja California, Mexico
2
LEGOS, Université de Toulouse, CNES-CNRS-IRD-UPS, 14 Avenue Edouard Belin, 31400 Toulouse, France
3
Facultad de Ciencias Marinas, Universidad de Colima, Carretera Manzanillo-Cihuatlán Km 19.5, Colonia El Naranjo, Manzanillo 28868, Colima, Mexico
*
Author to whom correspondence should be addressed.
J. Mar. Sci. Eng. 2021, 9(11), 1264; https://doi.org/10.3390/jmse9111264
Submission received: 7 September 2021 / Revised: 5 November 2021 / Accepted: 9 November 2021 / Published: 12 November 2021
(This article belongs to the Special Issue Offshore and Onshore Marine Renewable Energy)

Abstract

:
Most wave energy converters (WECs) are designed to operate in high-latitude energetic seas, limiting their performance in regions usually dominated by milder conditions. The present study assesses the performance of complete test-stage WECs in farms that satisfy a decentralized energy scheme (DES) on the coast of Baja California, which is considered one of the most energetic regions along the Mexican Pacific. A high-resolution 11-year nearshore wave hindcast was performed and validated with Acoustic Doppler Current Profilers (ADCPs) data to characterize the wave energy resource in the study area. Two hotspots were identified from the wave power climatology. In these sites, the extractive capacities of seven well-known WEC technologies were determined based on their power matrices. Finally, the power extracted by small WEC farms, with the minimum number of devices required to satisfy a DES, was estimated. The studied region has moderate wave power availability with marked seasonality and low inter-annual variability. Out of all the evaluated devices, WaveDragon extracts the highest wave power; however, Pelamis has the best performance, with maximum monthly mean capacity factors up to 40%. Coupling WEC farms with storage modules or hybrid renewable systems are recommended to satisfy a continuous DES during the less energetic summer months.

1. Introduction

Electricity is essential to the development of modern economies. The electricity sector accounts for the largest share of annual anthropogenic CO2 emissions from fossil fuel combustion globally. This makes it a focal point for climate change mitigation, environmental protection, and sustainable development [1].
Harnessing renewable energies to generate electricity creates new horizons regarding technological development and innovation worldwide, and is becoming a viable alternative for building resilient electrical systems that satisfy the growing energy demand of industrialized societies [2,3]. The global objective is that, by 2050, renewable energy sources satisfy 86% of energy demand [4]. To this end, various sources are being explored to produce sustainable energy. The most common are hydroelectric, biomass, wind, geothermal, and solar energy. However, marine renewable energy (MRE) is an abundant and essential resource for achieving this goal [5].
There are five main MRE sources: ocean currents and tides, salinity gradients, thermal gradients, offshore wind generation, and wind and waves [6,7]. Wave energy is one of the most promising MRE sources to be exploited on a large scale due to its high energy density per unit area and the feasibility of its capture [8]. In addition, wave energy has the second highest availability among all MRE sources [9].
It is estimated that the worldwide wave energy availability is around 29,500 TWh yr−1 and that, on average, each wave front could transmit between 10 and 15 kW·m−1 [10,11]. The extratropical regions of both hemispheres have the highest wave power, exceeding 60 kW·m−1; this decreases with latitude towards the equatorial region, where values are lower than 10 kW·m−1 [12]. Wave power in the Mexican Pacific coast is within the resource’s exploitable range, with available power of up to ~10 kW·m−1 at least 50% of the time [6]. In particular, the Baja California peninsula has the highest wave power availability on the Mexican coast, with maximum mean values close to 20 kW·m−1 [13].
Ocean waves carry part of the energy transferred from the atmosphere to the ocean over long distances. An advantage of wave energy is that it is predictable and flows naturally from generation areas to the coast, where it can then be harvested and transformed into electricity via wave energy converters (WECs). Its operating principle is based on oscillatory movements or pressure fluctuations under the free surface of the ocean [12]. In this way, kinetic or potential wave energy can be transformed into usable electrical energy. The WEC performances are heavily dependent on the dominant sea state and its temporal and spatial variability [14]. The type of WEC selected depends mainly on the wave conditions, the physical characteristics of the area of interest, and the device’s operating principle and associated costs [13,15].
Many studies [16,17,18,19] have shown how different WEC technologies can optimally and efficiently harvest wave energy. These can be classified by various methods, such as location, structure, principle of operation, size and orientation, and power take-off systems [20]. WEC devices are typically designed to operate in coastal regions or on the open sea [21]. Onshore and nearshore systems have the advantage of easy installation and maintenance. This is because they generally do not require an underwater power cable to connect to the power grid or expensive anchors in deep waters. However, these nearshore systems usually operate under lower energy wave regimes, which may be subject to potentially dangerous loads due to wave breaking [22]. On the other hand, offshore systems are usually floating devices operating in water depths greater than 40 m [5].
However, due to different challenges, there is currently no WEC technology that is mature enough to harness the resource efficiently and reliably [20]. Some of these challenges include a lack of investors and a broad diversity of prototypes, as well as high structural installation and maintenance costs [16,20].
For power generation to be economically viable, arrays of multiple WECs—also called wave energy farms—must be installed in the marine environment [17,18,19]. The number of WECs per farm depends on at least four factors: (1) local wave conditions, (2) the technology readiness level (TRL) of the selected devices, (3) the technology performance level (TPL), and (4) the electrical marketing scheme to be supplied. It is necessary to understand the possible implications that the WEC facility could have on the coastal ecosystem to achieve sustainable development [23]. The magnitude and impact of wave energy farms depend on their design and location, as well as on the incident wave conditions [24,25].
The centralized electricity system is the traditional management scheme used to transport energy that is generated at a few large power plants and then distributed to consumers. However, global economic and demographic development, as well as the lack of local electrical infrastructure (e.g., isolated non-electrified areas), have generated the need to seek innovative solutions that adapt to local needs and to ever-increasing electrical demand [26].
Decentralized energy schemes (DES) have emerged as a possible technical and economical alternative to shift towards systems that do not depend on centralized generation [27]. The DES consists of an autonomous energy supply through low-capacity plants close to the consumers [28]. Thus, access to energy services can be expanded by exploiting locally available renewable energy sources [29]. In this way, wave energy can be part of a DES to provide power services near the end-user in remote areas with low load requirements. Concerning their harnessing, the selection of such electrical systems depends mainly on the TRL and TPL of the WEC devices and the desired installed capacity of the wave energy farms.
There are several DES options: systems directly connected to the distribution grid, systems where electricity production is isolated from the grid (fully decentralized), and hybrid systems where a centralized grid and a local DES coexist [26,29]. This results in new requirements for energy management and grid operation, as well as the need for responsive economic, social, political, and regulatory environments [30]. Particularly, the DES regulations in Mexico are defined for generation systems with capacities of less than 0.5 MW [31].
DES offer a wealth of environmental, economic, technical, and social advantages for consumers. The use of on-site renewable energy generates environmental benefits in terms of system efficiency and reduction of greenhouse gas emissions. By allowing energy production to be closer to the consumer, DES offers promising opportunities for project feasibility and benefits associated with capital cost-saving, due to reducing the need for transmission and distribution lines, reducing transmission and distribution inefficiencies, and creating electricity independence, flexibility, and strengthened national energy security [26,28]. The creation of MRE prosumers, such as self-consumption cooperatives, could help meet different needs in communities by promoting their resilience in the short term [32,33]. This, in turn, could generate indirect benefits that help stimulate the local economy through the integration and development of new local opportunities that improve the welfare of coastal communities with deficient or non-existent electricity in Mexico [34].
The main goal of this study is to assess the performance of WEC farms that satisfy a DES in the region of Todos Santos Bay (TSB) in Baja California, Mexico. For this purpose, wave energy availability is evaluated according to the spatial and temporal variability of the resource. In addition, the extractive capacity of the WEC devices is quantified. Finally, the power extracted with WEC farms is estimated, according to a DES scheme.

2. Materials and Methods
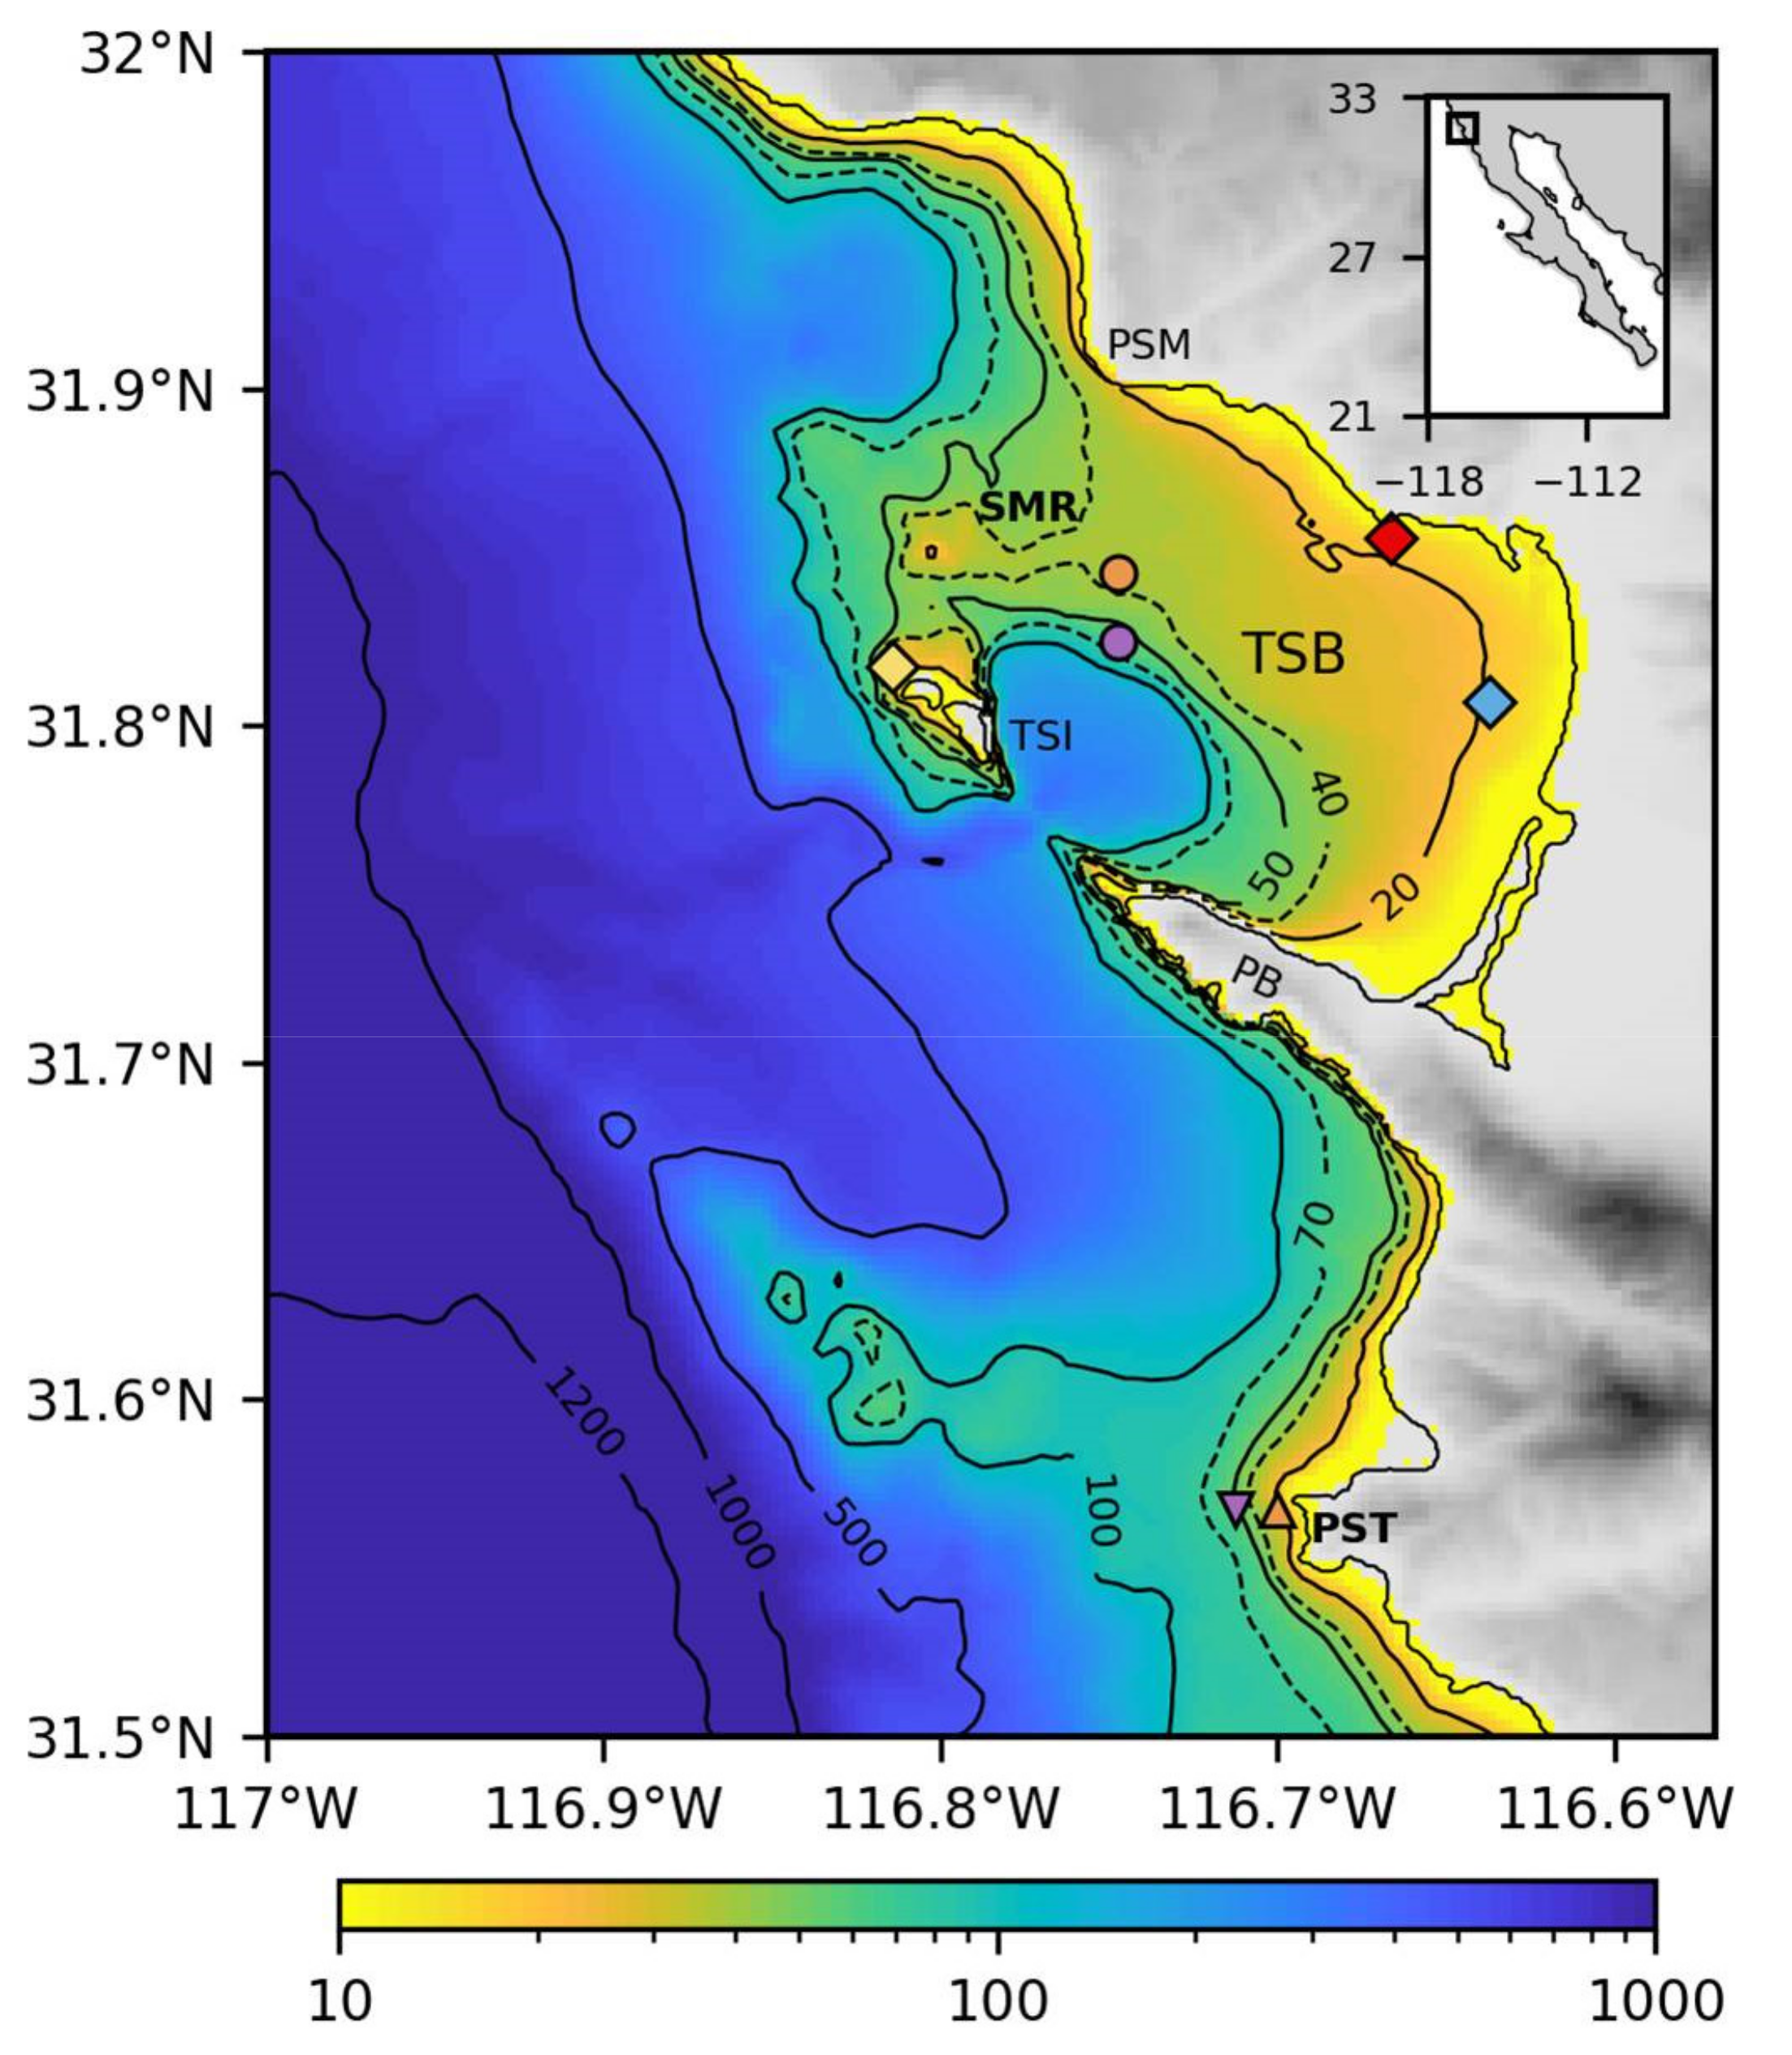
The study was carried out in three stages to assess the performance of the different WEC farms with numerical wave model simulations. First, the climatology and the variability of wave power were determined. Then, the extractive capacity of different WECs was evaluated based on their response to local wave conditions. Lastly, the wave power extracted by WEC farms that satisfy a decentralized energy scheme was estimated.

2.1. Study Area

Todos Santos Bay is located on the northwestern coast of the Baja California peninsula in Mexico (Figure 1). It is a semi-sheltered bay delimited by Punta San Miguel (PSM) in the North and Punta Banda (PB) in the South.
The sea state around TSB is commonly composed of different wave systems coexisting at the same time. The main sources of swells arriving at the area are the extratropical North and South Pacific regions. The North Pacific swells occurs mainly in autumn and winter, while the South Pacific swells is more energetic in summer, but occurs all year round.
Significant wave height ( H s ) has a markedly annual cycle, with higher waves in winter and lower waves in summer [35]. Outside the bay, the mean H s of the winter months is between 1.5 m and 2 m, while in summer, it decreases to values around 1 m. The mean monthly peak period is between 13 s and 15 s. The inner section of the bay is partially protected from the South Pacific swells by the Todos Santos Islands (TSI). Within the bay, H s is smaller than in the outer section and has a somewhat more pronounced annual cycle, with around 1.3 m in winter and 0.7 m in summer, and an overall average of about 1 m. The incidence of storms in the area increases between October and April, with a maximum H s of 3 m to 4 m.

2.2. Wave Model Setup

Numerical wave simulations were performed to characterize the spatial-temporal distribution of wave characteristics and the available wave power within TSB and its surroundings. The third-generation wave model SWAN Cycle IV version 41.20AB [36] was implemented in an area of 0.5° by 0.5°, from 31°30′ to 32° N and from 117° to 116°30′ W. The model was run in a non-stationary two-dimensional mode from 1 January 2008 to 31 December 2018, with hourly output data. The domain was discretized in a regular grid with a spatial resolution of 0.0025° (approximately 280 m) and with an equal logarithmic spaced frequency resolution with 41 frequencies, from 0.04 Hz to 0.7 Hz, and a directional resolution of 5°.
The SWAN model was forced at the boundaries with directional waves spectra from the IOWAGA wave hindcast [37]. IOWAGA was developed by the French Research Institute for Exploitation of the Sea (IFREMER); it is based on a global implementation of the wave model WaveWatch III forced with winds from the ECMWF. It has a global grid resolution of 0.5° and uses a multi-grid system to provide higher resolution at different locations. Data used here as boundary conditions are from the PACE subgrid, which has a resolution of 1/6°. There are five nodes of IOWAGA along the local boundary of SWAN. At these locations, directional wave spectra were provided every 3 h.
The SWAN numerical results were validated using available wave data from Acoustic Doppler Current Profilers (ADCPs) deployed at three locations (Figure 1) within the TSB.

2.3. Wave Energy Resource Assessment

The available wave power density   P , or wave energy flux, was computed directly from the simulated directional spectra E ( f , θ ) as,
    P = ρ g c g f E f , θ d f d θ ,
where ρ is the water density of water, g is the gravitational acceleration, c g f   is the group velocity at each frequency, and f and   θ are wave frequency and direction, respectively. The seasonal climatology was computed. Seasonal changes were defined as the following: winter (January to March), spring (April to June), summer (July to September), and autumn (October to December).
Temporal variability of wave power is an important factor to consider when selecting WEC locations. Sites with more regular and uniform wave power are preferable to those with highly variable wave conditions, as they might be more reliable for extraction of the energy resource. The temporal variability of wave power, at different time scales, was characterized by the coefficient of variation ( CoV ), the annual variability index ( AVI ), and the seasonal ( SVI ) and monthly ( MVI ) variability indexes, computed as [38],
    CoV = σ P P ¯ ,
    AVI = P ¯ A 1 P ¯ A 2 P ¯ y e a r ,
    SVI = P ¯ S 1 P ¯ S 2 P ¯ y e a r ,
    MVI = P ¯ M 1 P ¯ M 2 P ¯ y e a r ,
where σ P is the standard deviation of wave power, P ¯ is the overall average wave power, P ¯ y e a r the yearly mean available wave power; and   P ¯ A 1   , P ¯ A 2 , P ¯ S 1 , P ¯ S 2 , P ¯ M 1 , P ¯ M 2 are the mean values for the most (subindex 1) and the least (subindex 2) energetic years (subindex A), seasons (subindex S), or months (subindex M), respectively. Therefore, these indices determine which areas receive a more regular and constant wave power and which are more variable. The CoV calculates the variability concerning the mean value during the period considered and is based on hourly wave power values, which are more sensitive to extreme values. In contrast, AVI , SVI , and MVI indexes rely on annual, seasonal, and monthly averages, respectively, being more sensitive to the large time scale variability.

2.4. Extractable Wave Power

Seven well-known WECs with different designs and operational principles were evaluated to quantify harvestable wave energy. These were the AquaBuOY, WaveStar, Oyster315, Oyster800, WaveDragon, OWCFloating, and Pelamis [39,40,41,42,43,44]. From the point of view of their operability, these technologies cover the whole range of existing WEC types that have reached the full test stages. The first two are point absorbers, the third and fourth are oscillating wave surge converters, and the following are overtopping, oscillating water column, and attenuator devices, respectively [20]. Since the WECs are designed to operate in different water depths, two regions were defined: a shallow one (between 10 m and 40 m water depth) and a deep one (between 40 m to 70 m water depth) [21]. Pelamis was designed to work optimally at depths between 50–70 m (offshore region) and AquaBuOY between 20–50 m (nearshore and offshore regions). At the same time, the other devices can be installed in shallow coastal locations (nearshore regions), generally between 10 m and 40 m water deep.
The harvestable wave power ( H P ) was computed as [45],
    H P = H R H s , T p · P W E C H s , T p ,  
where H R is the availability matrix, which represents the probability of occurrences of the different sea states expressed as a fraction from the total number of observations and P W E C is the corresponding WEC power matrices, obtained from publicly available technical data of the seven devices considered [39,40,41,42,43].
The H R , also known as the joint distribution, was computed using the hourly H s and   T p . These parameters for the deep and shallow locations of San Miguel Reef (SMR) and Punta Santo Tomas (PST; Figure 1) were obtained from the SWAN model simulations.
To facilitate the comparison between WECs, their efficiencies were determined by normalizing H P with the physical width of each device [44]. Their performances were evaluated considering the fraction of time that the WECs operate at full capacity [39], according to the capacity factor ( C f ), as in [46].

2.5. Wave Power Extracted by WEC Farms to Satisfy a DES

The harvestable wave power of different WEC farms was evaluated at the selected sites through numerical simulations of WEC arrays with the SNL-SWAN model. This spectral numerical model is a version of SWAN, developed by Sandia National Laboratories, which incorporates a module for WEC analysis and performance studies [47,48]. The number of WECs per farm and site was chosen to obtain an average generation capacity close to 0.5 MW to satisfy the Mexican regulations for a DES [31].
For the WEC farms simulations, SNL-SWAN was implemented at the selected sites in 2 km × 2 km areas with a spatial resolution of 20 m. Since one of the objectives of this work is to evaluate the performance generated by seven known WECs, the two WECs that produced the highest overall extracted power capacity at the selected sites are considered for this analysis: WaveDragon and Pelamis. These WECs were included in the model as obstacles using their corresponding P W E C s , obtained from [39,41].
For each WEC array, a set of stationary runs were performed using wave characteristics from the 10-year SWAN runs as a reference and as boundary conditions. First, the joint distribution of H s and T p , i.e., the availability matrix, at the middle of the offshore boundary of the farm domain, was computed. Then, for each combination of H s and T p with data occurrence on the reference availability matrix, i.e., for all the sea states occurring at the offshore boundary, the mean H s and peak direction ( D p .) were computed for the exact times, as those included in the reference combination and at all the nodes of the regional runs along the farm-domain boundaries. Finally, a stationary run of SNL SWAN, with spatially varying boundaries, was performed for each offshore reference sea state by forcing with the corresponding mean H s ,   T p , and D p .
The model results included the wave power extracted by each WEC in the array for each stationary run. All runs performed for the same WEC farm were used to compute an in-site  P W E C matrix. The extractable power by each WEC in the array was computed using Equation (6), replacing P W E C with its corresponding in-site  P W E C and where H R is the reference availability matrix at the offshore boundary.

3. Results

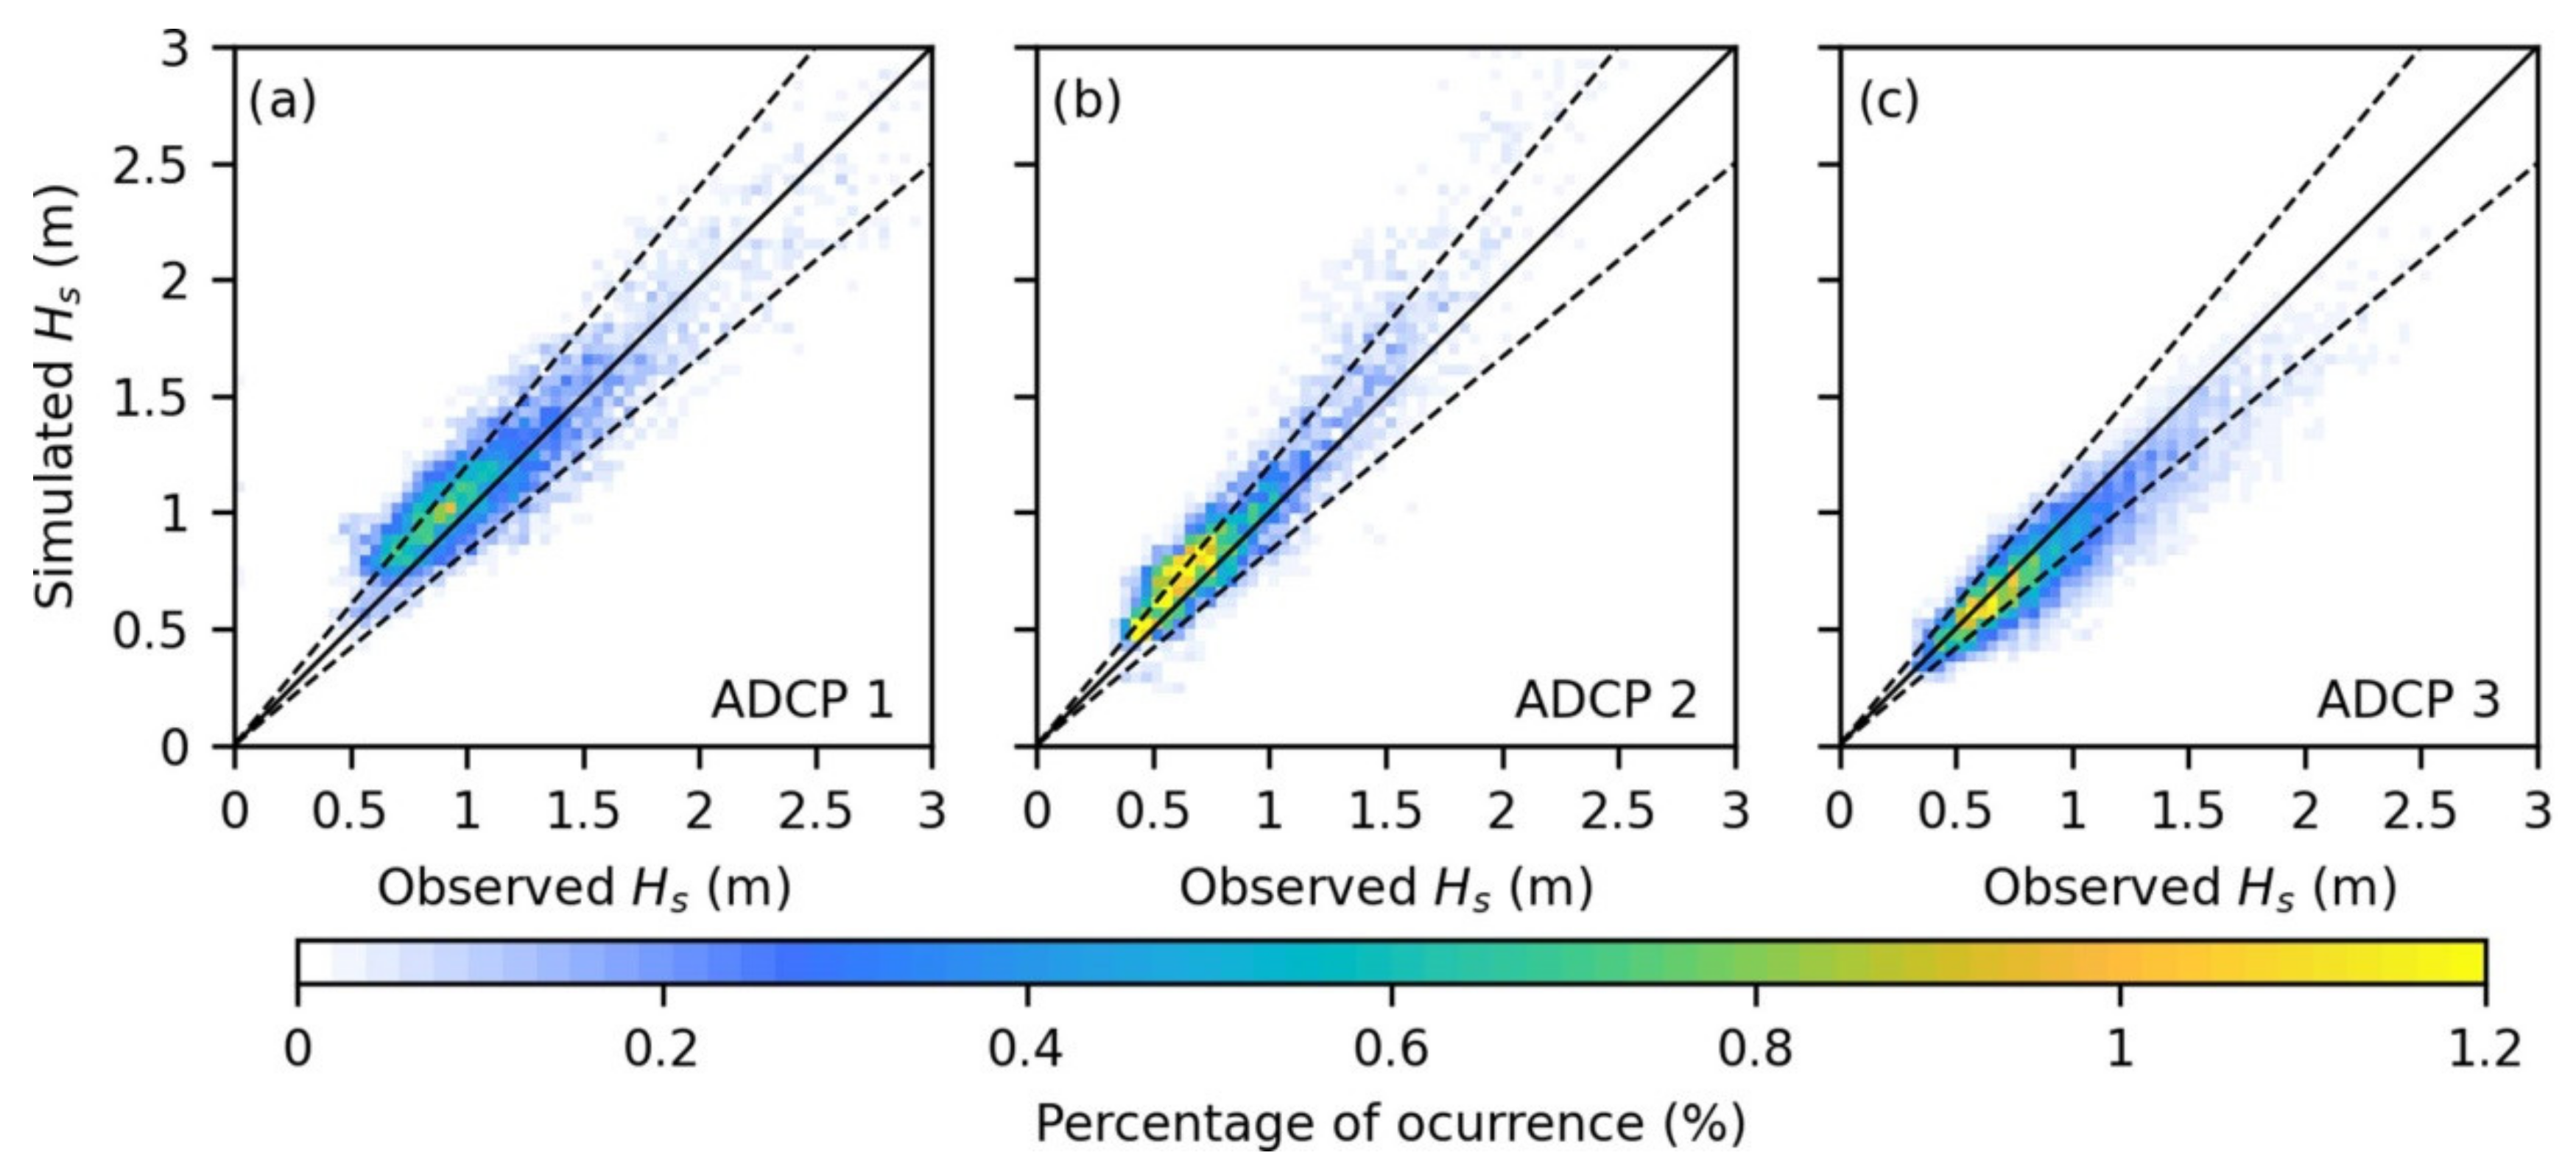
3.1. Wave Model Validation

The comparison between the observed and the modeled wave characteristic is summarized in Table 1. In general, there is good agreement between the simulations and the wave measurements at the three ADCP locations. The linear correlation coefficients are higher than 0.92 and 0.55 for H s   and   T p , respectively. The apparent low correlation between observed and modeled T p is caused by the occurrence of sea states with two coexisting wave systems with similar energy levels, but different wave periods. This causes large differences in T p when a different peak is identified as the maximum in the modeled and in the observed spectra. The mean bias of H s and T p are lower than 0.1 m and 0.8 s, respectively, showing a slight over-prediction of H s and T p for ADCP 1 and ADCP 2, while for ADCP 3, H s is under-predicted. The RMSE for H s is of the order of 0.22 m and for T p , it is 2.78 s. The low bias ranges and high correlation values between observed and modeled results provide confidence in our dataset.
Figure 2 shows a scatter diagram of the observed and simulated comparisons of H s at the three ADCP locations. As can be seen, almost all data fall within the 90% confidence regions calculated based on the sampling variability following [49]. Relatively satisfactory agreement between simulations and measurements is observed. There is a good representation of the most common swells arriving at the area, with H s ranging between 0.75 m and 1.25 m for ADCP 1 (Figure 2a), 0.5−0.8 m for ADCP 2 (Figure 2b), and 0.5−1.2 m for ADCP 3 (Figure 2c). ADCP 3 has the best correlation of the most common waves in the area where the highest H s percentages align along the line of perfect agreement (black line in Figure 2), whereas in ADCP 1 and ADCP 2, the most common waves are slightly overestimated by the model. The best representation of extreme values occurs in ADCP 1, while extreme values in ADCP 2 and ADCP 3 are overestimated and underestimated by the wave hindcast, respectively.

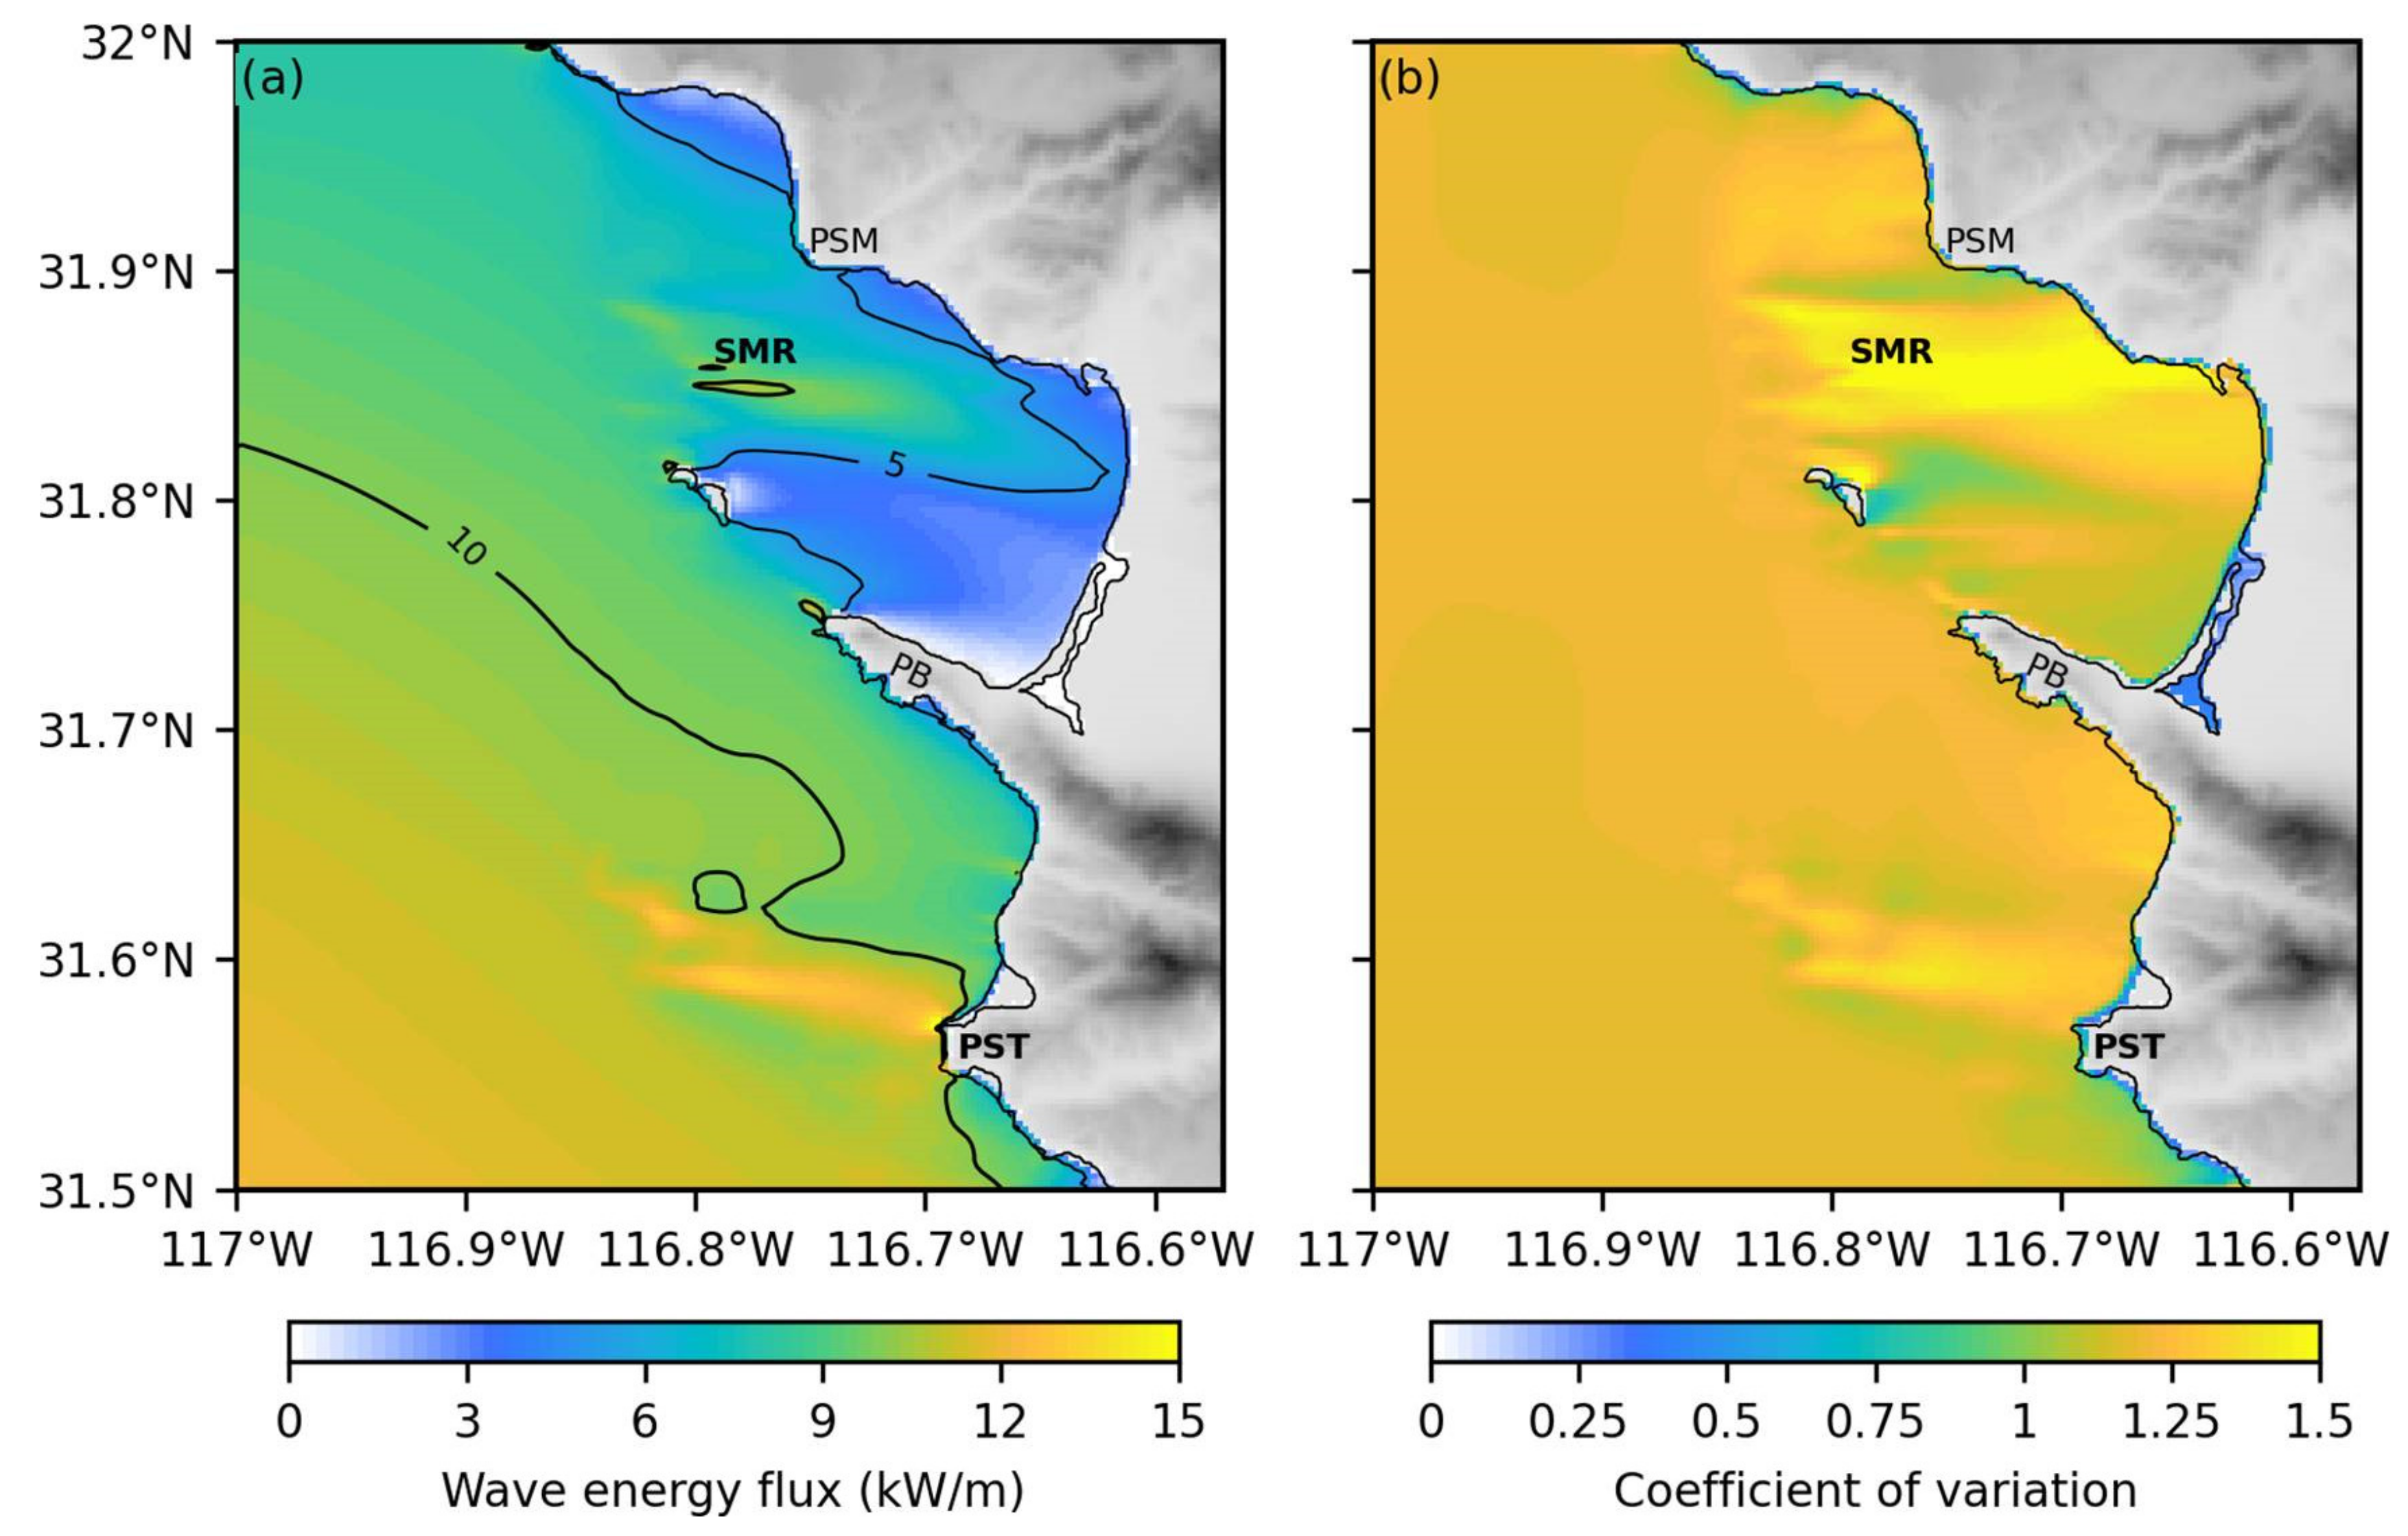
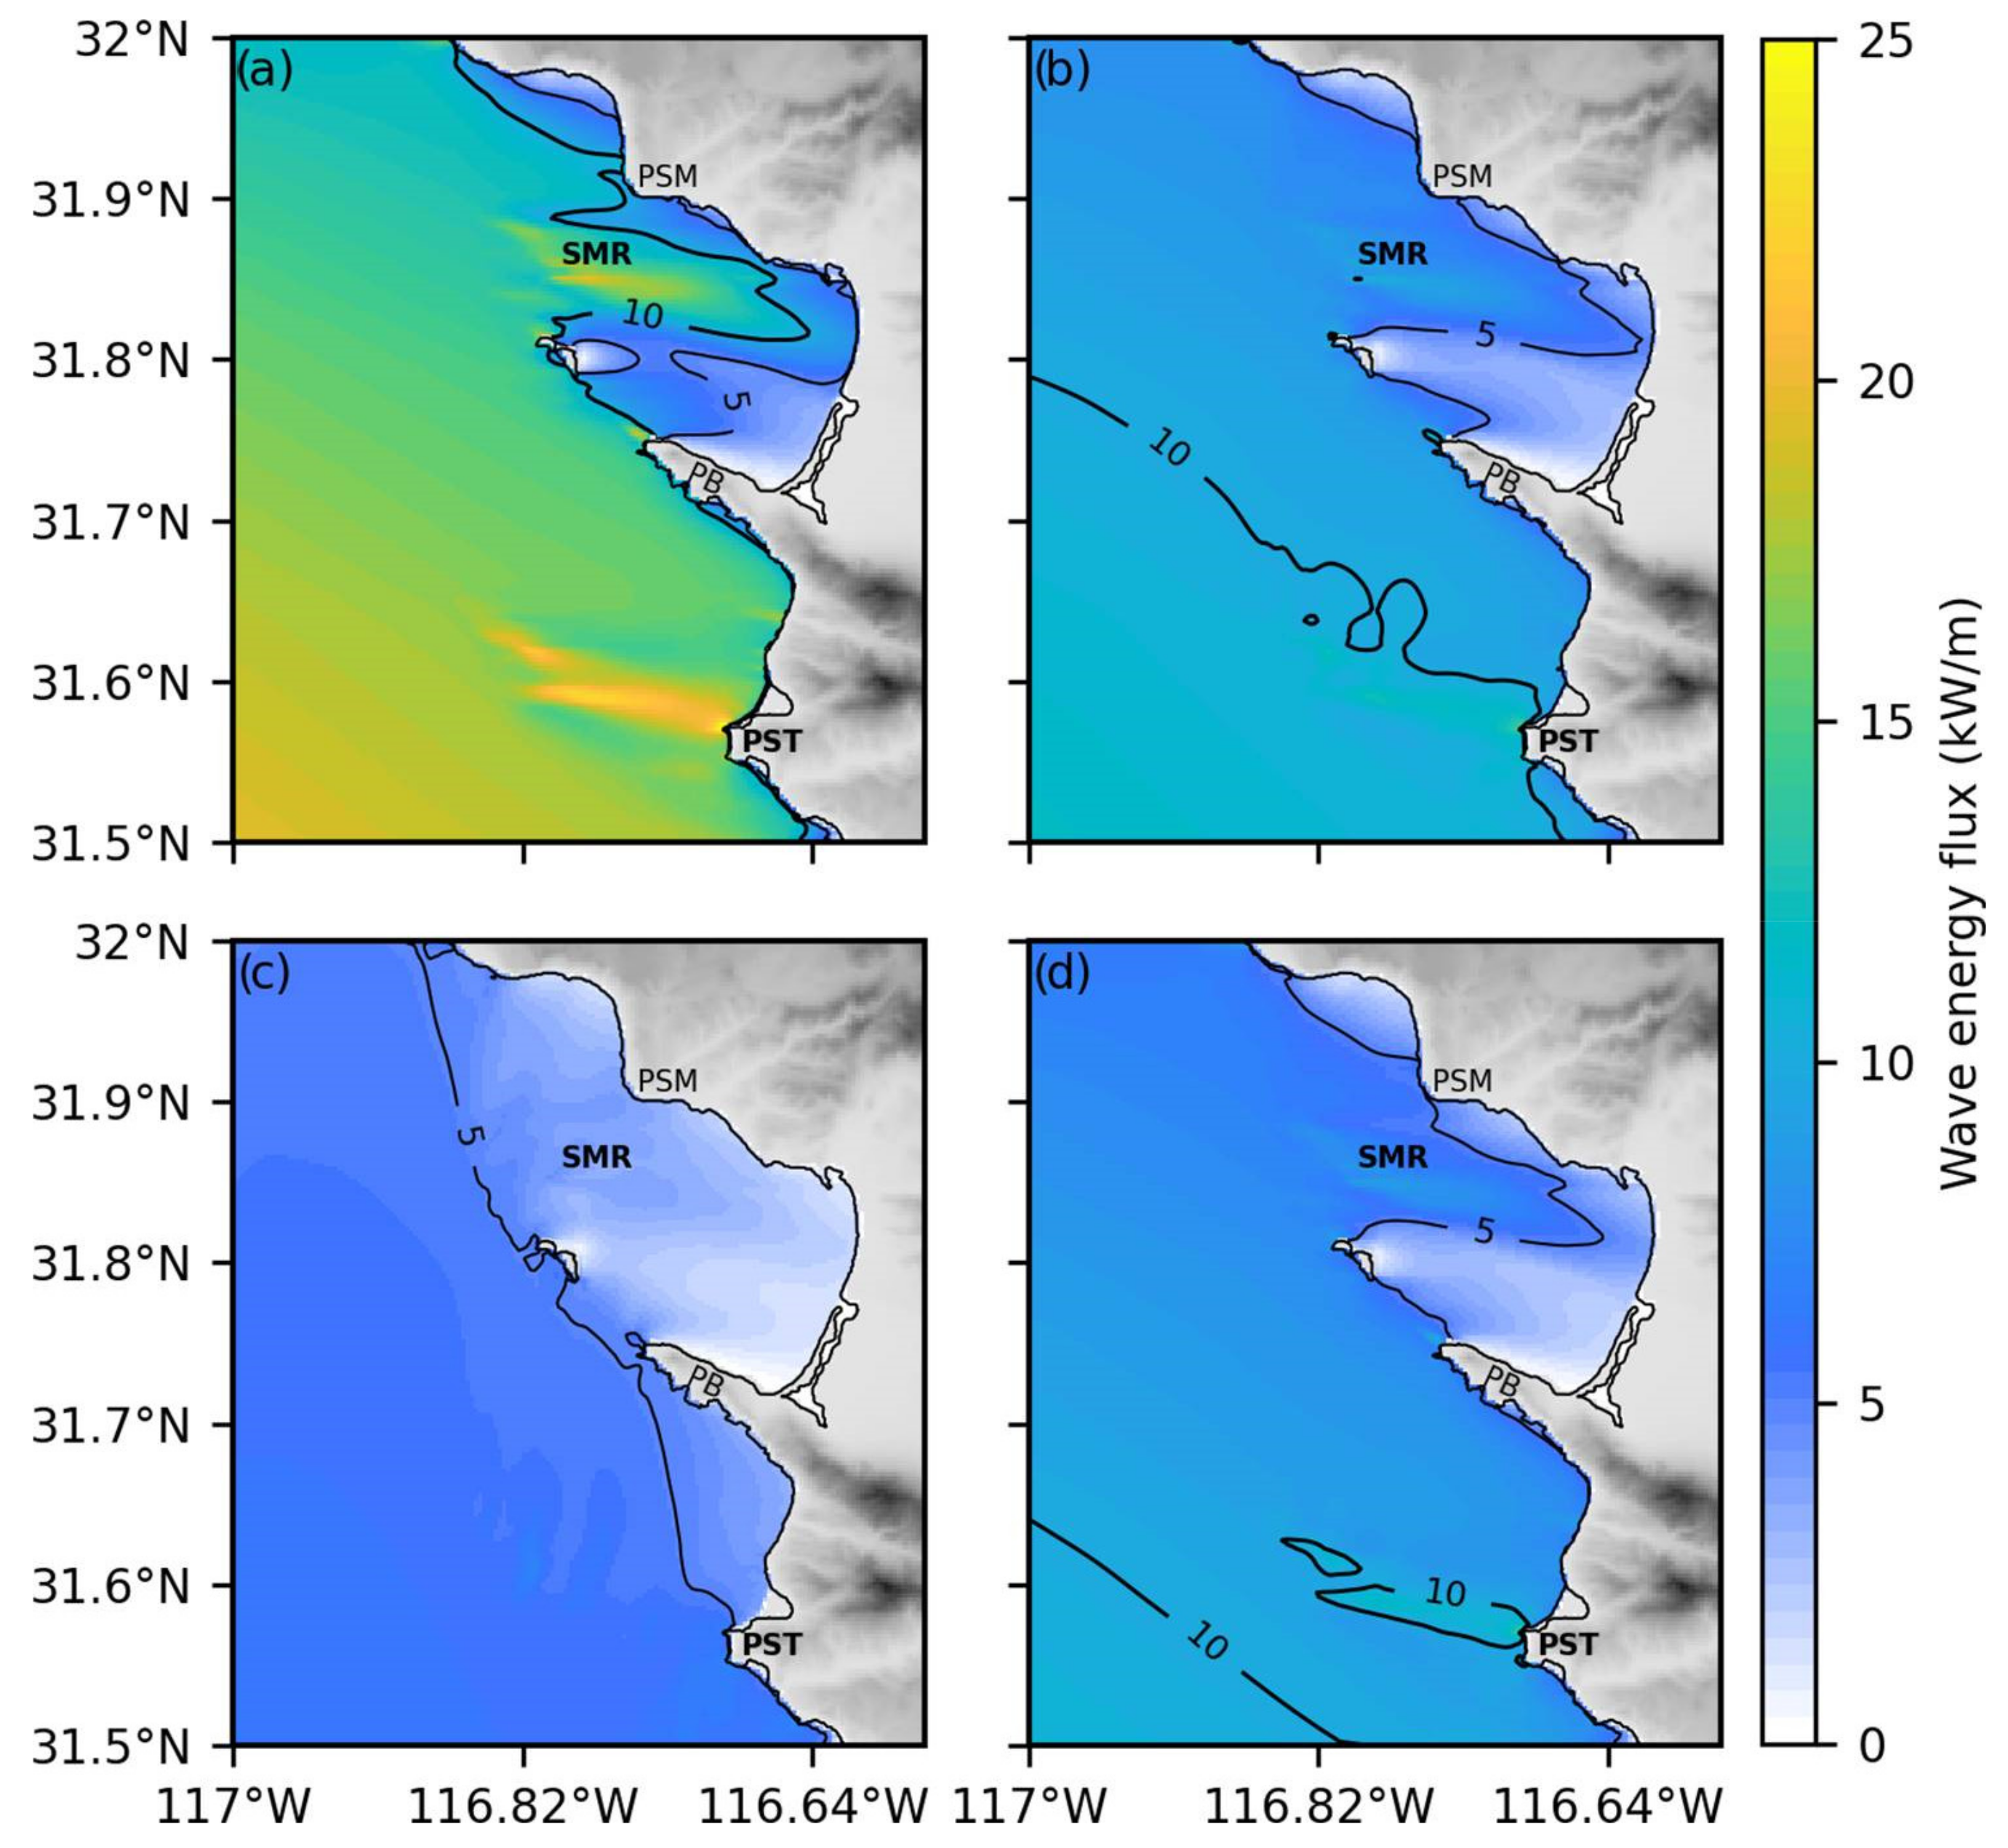
3.2. Wave Power Available

The mean wave power and the coefficient of variation in the study area are shown in Figure 3a,b, respectively. The region has a moderate P ¯ (Figure 3a) with an average value close to 10 kW·m−1. The P ¯   varies spatially, with higher values outside TSB than inside. Outside the bay, the P ¯   is around 12 kW·m−1 and increases from north to south, with a maximum of 14 kW·m−1 in the southern region, where the 10 kW·m−1 isoline is found closer to shore than in the northern region. The highest P ¯ of the study area occurs at PST, outside the TSB, with values between 13 kW·m−1 and 15 kW·m−1. Within the bay, the P ¯   is around 8 kW·m−1, increasing from south to north, with a range of values from 5 kW·m−1 to 11 kW·m−1. The SMR is the TSB site with the highest P ¯ , with values of 11 kW·m−1 for shallow and 9 kW·m−1 for deep locations. As shown in Figure 3b, the domain shows a CoV trend similar to the P ¯ availability, with a marked average temporal variability of wave power close to 1.15. Outside the TSB, both the northern and southern regions have the highest CoV values, close to 1.2. Particularly at the PST site, the shallow and deep locations have values of 1.2 and 1.17, respectively. Within the TSB, the northern region has a 50% higher P ¯ variability than the southern region, with the highest CoV value observed at the SMR site, at 1.35. On this site, the shallow and deep locations have CoV values of 1.48 and 1.22, respectively.
PST and SMR are the best sites to harvest wave power in terms of resource availability. The H R of their respective locations are presented in Figure 4. All test sites show a similar pattern of wave occurrence, with a higher range of T p than   H s , from 4.5 s to 19.5 s and 0.5 m to 3.75 m, respectively. The most common wave power was concentrated between H s of 0.75 m and 1.5 m and T p of 10 s and 16 s. Two wave trains are distinguished. The first train is related to short waves with a lower H R , with H s ranges of 0.75−1.5 m, and T p of 4.5−12 s. The second train is related to long waves with H s between 0.5 m and 1.75 m and a T p of 9 s to 18 s. The outer TSB locations (Figure 4c,d) have higher wave power ranges (isolines of 5 kW·m−1 to 20 kW·m−1) than the inner locations (Figure 4a,b), with values from 2 kW·m−1 to 11 kW·m−1. In addition, locations outside TSB show a higher H s range and greater frequency of extreme wave power events ( H s > 3 m and wave power > 50 kW·m−1) than inner TSB locations. Both deep and shallow SMR locations show a higher H R , in the range of H s 0.75−1 m and T p 12−14 s, than the PST locations. The PST and SMR shallow locations present the highest and lowest dispersion of peak energy, respectively, with a maximum energy concentration of H s 0.75–1 m and T p 12.5 s.
The seasonal mean wave power availability is presented in Figure 5. A marked seasonal trend can be observed, with maximum P ¯ during the winter and minimum during summer. A P ¯ about three times higher is observed during winter (16 kW·m−1, Figure 5a) than in summer (5.3 kW·m−1, Figure 5c). The spring and fall times have an intermediate P ¯ availability between winter and summer, with spring being higher (10.5 kW·m−1, Figure 5b) than fall (7.5 kW·m−1, Figure 5d). During all seasons, higher P ¯   availability occurs outside TSB. In winter, the PST site presents the highest resource availability, with a maximum mean value close to 25 kW·m−1, while the SMR site shows a maximum mean of 17.5 kW·m−1.
Table 2 presents the overall mean wave power and its variability indices for the selected sites. The PST site has, on average, a 40% higher P ¯ than the SMR site. The PST deep location is 15.3% more energetic than the shallow one, while the SMR shallow location is 22.2% more energetic than the deep one. When comparing the shallow and deep locations between sites, the four variability indices are lower at PST sites than at SMR sites. In addition, the deep PST location has the lowest values of the four indices quantified, while the shallow SMR location has the highest value. Both sites presented smaller values of AVI , followed by CoV , SVI , and MVI .

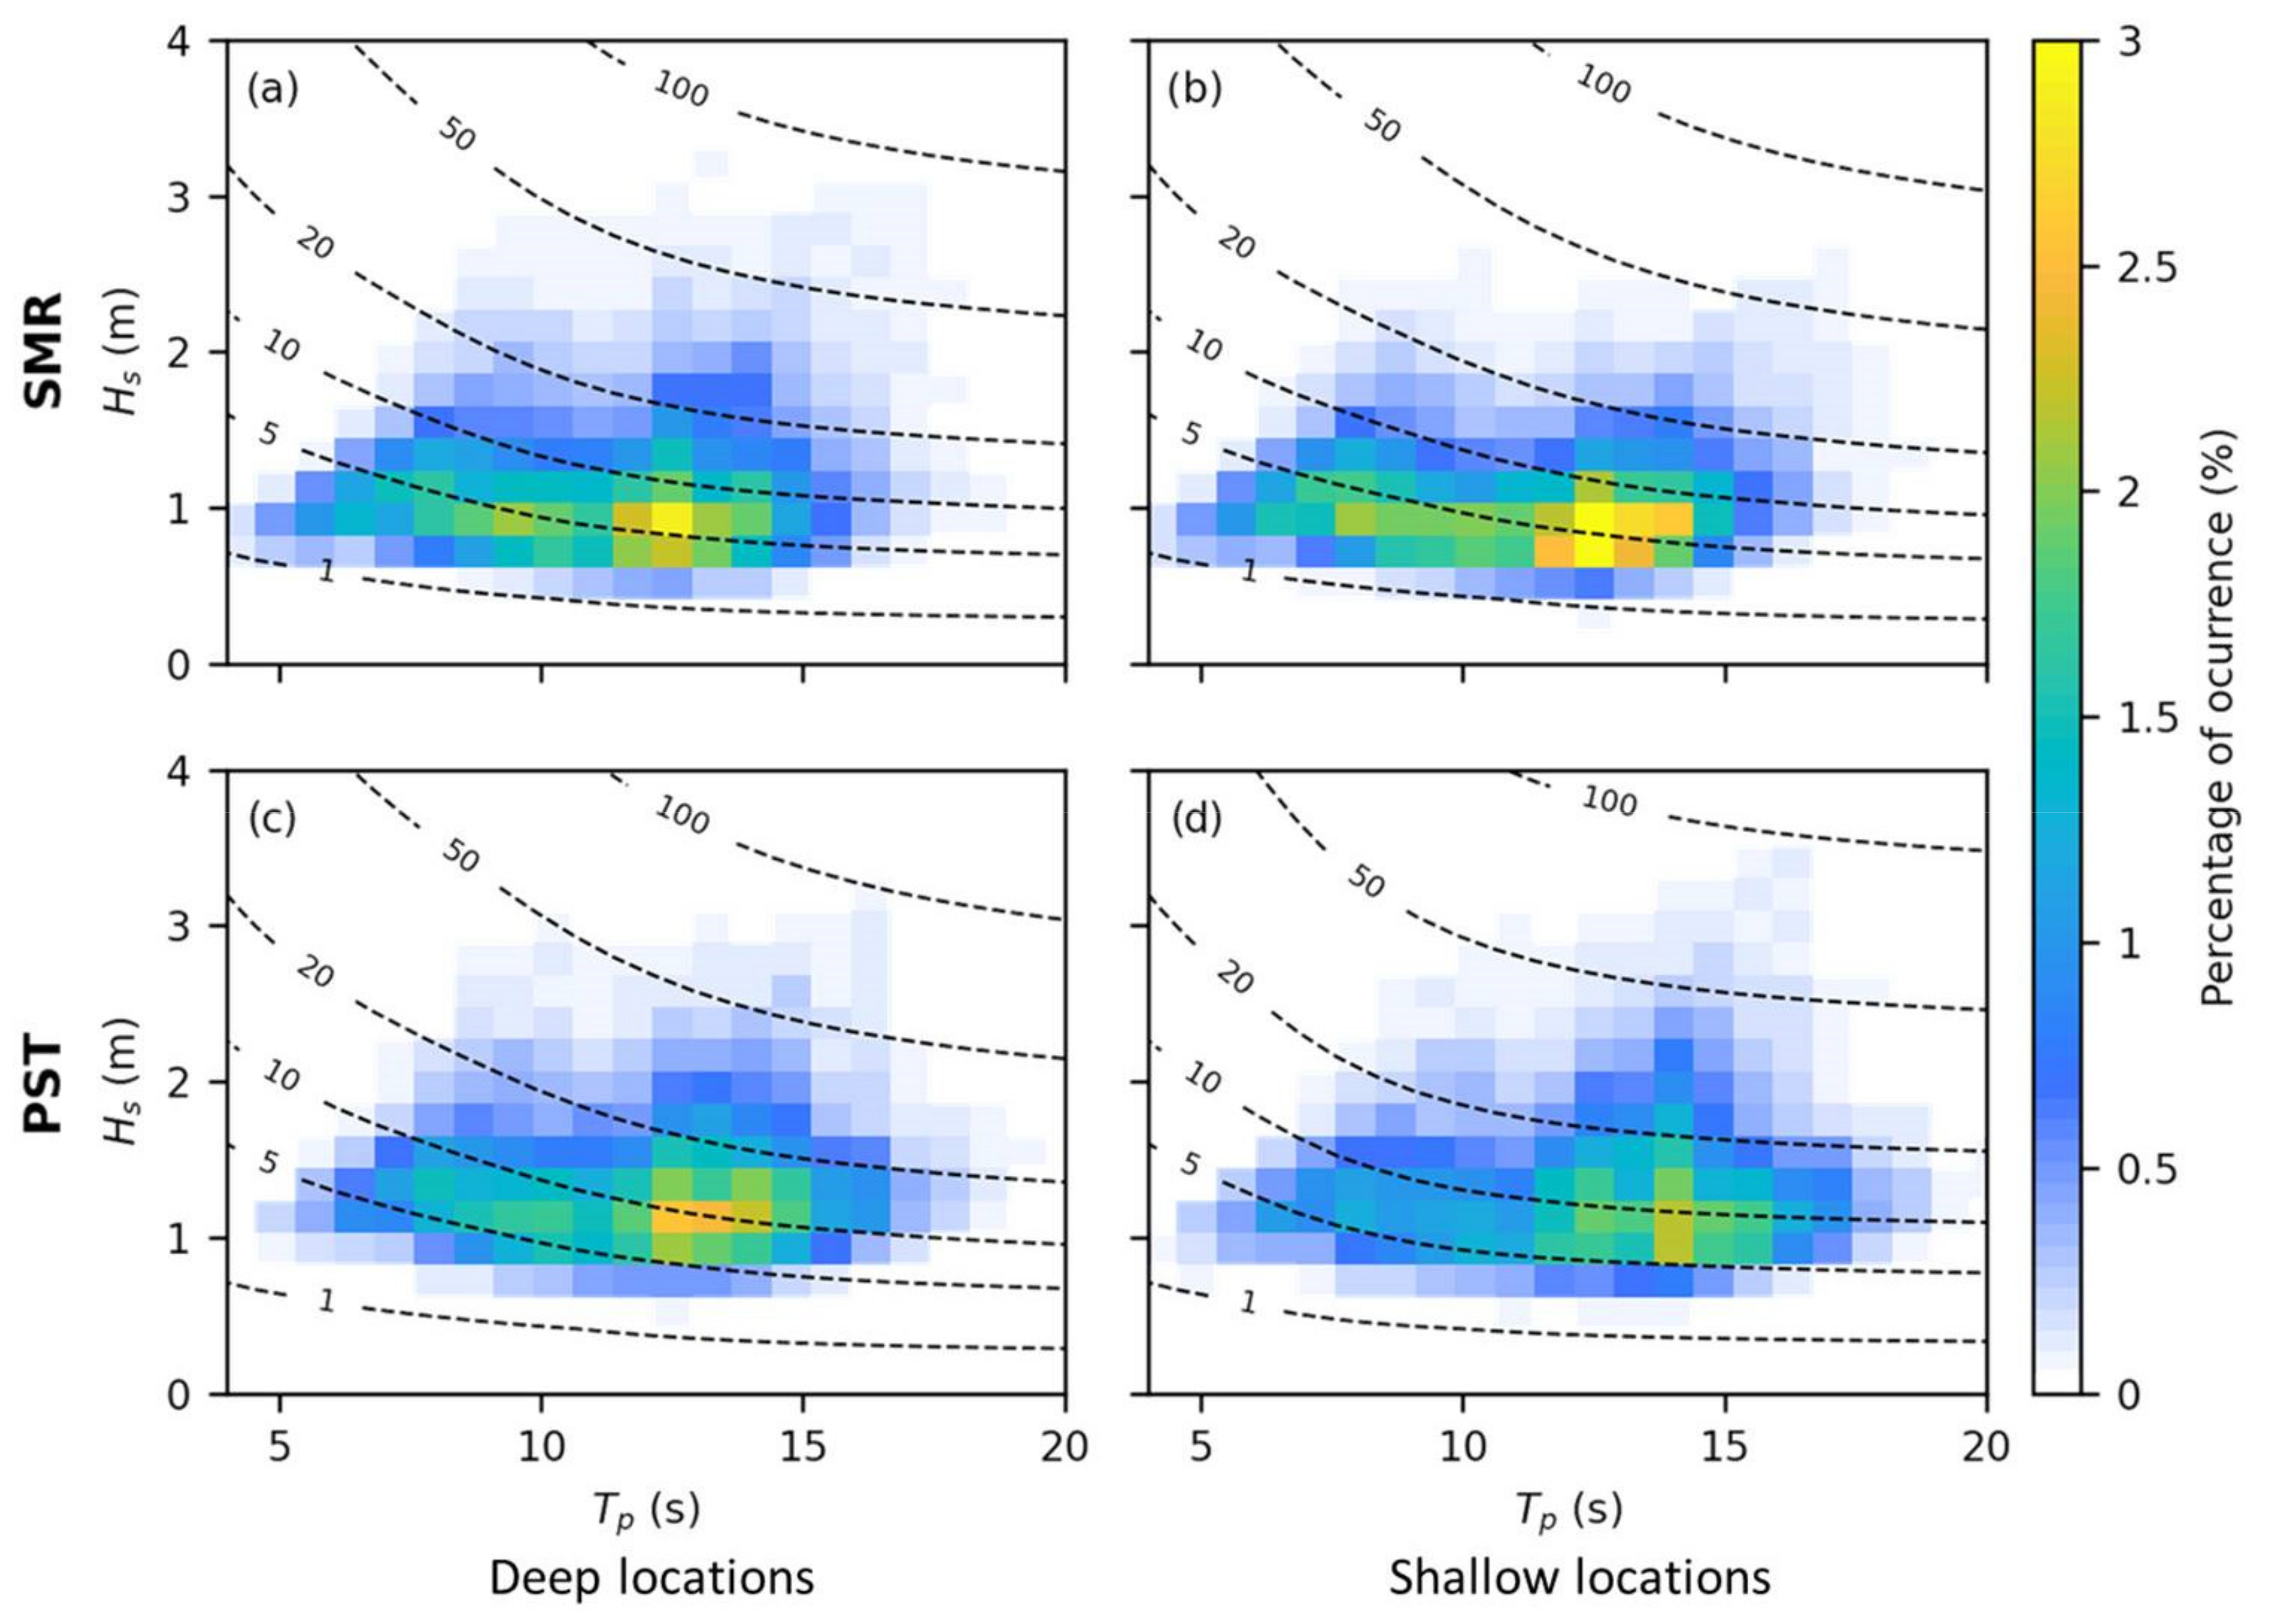
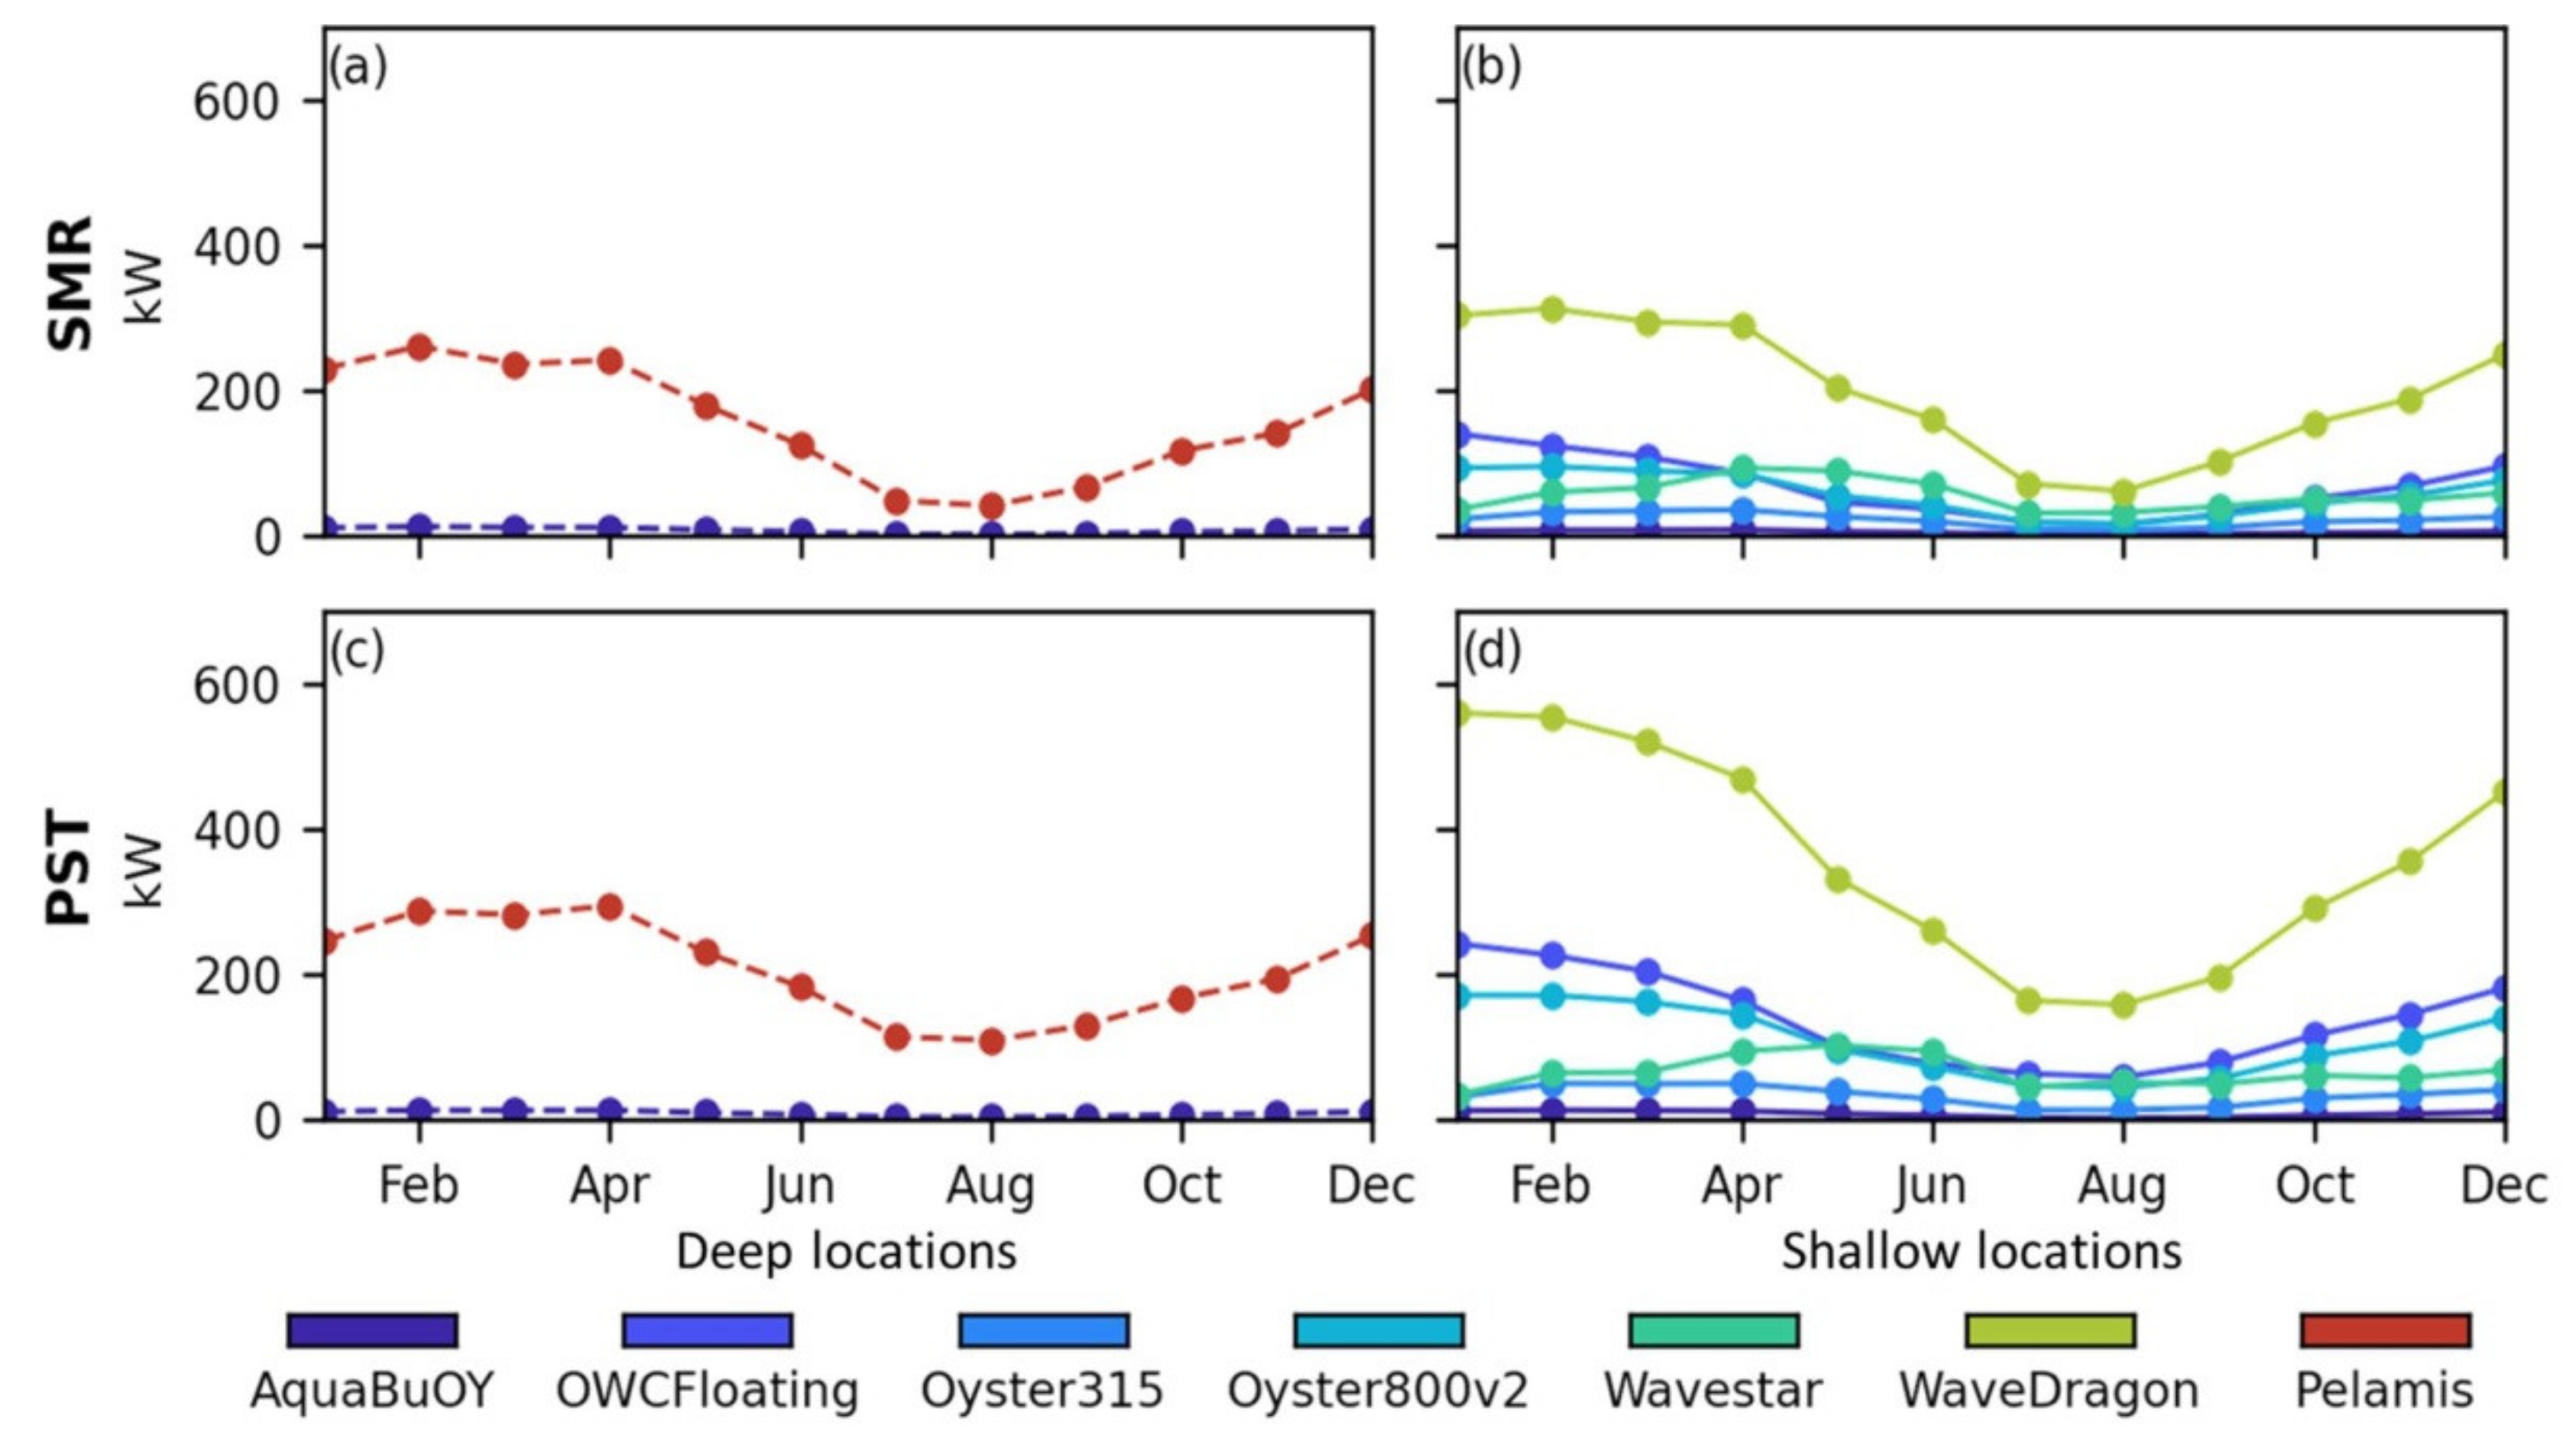
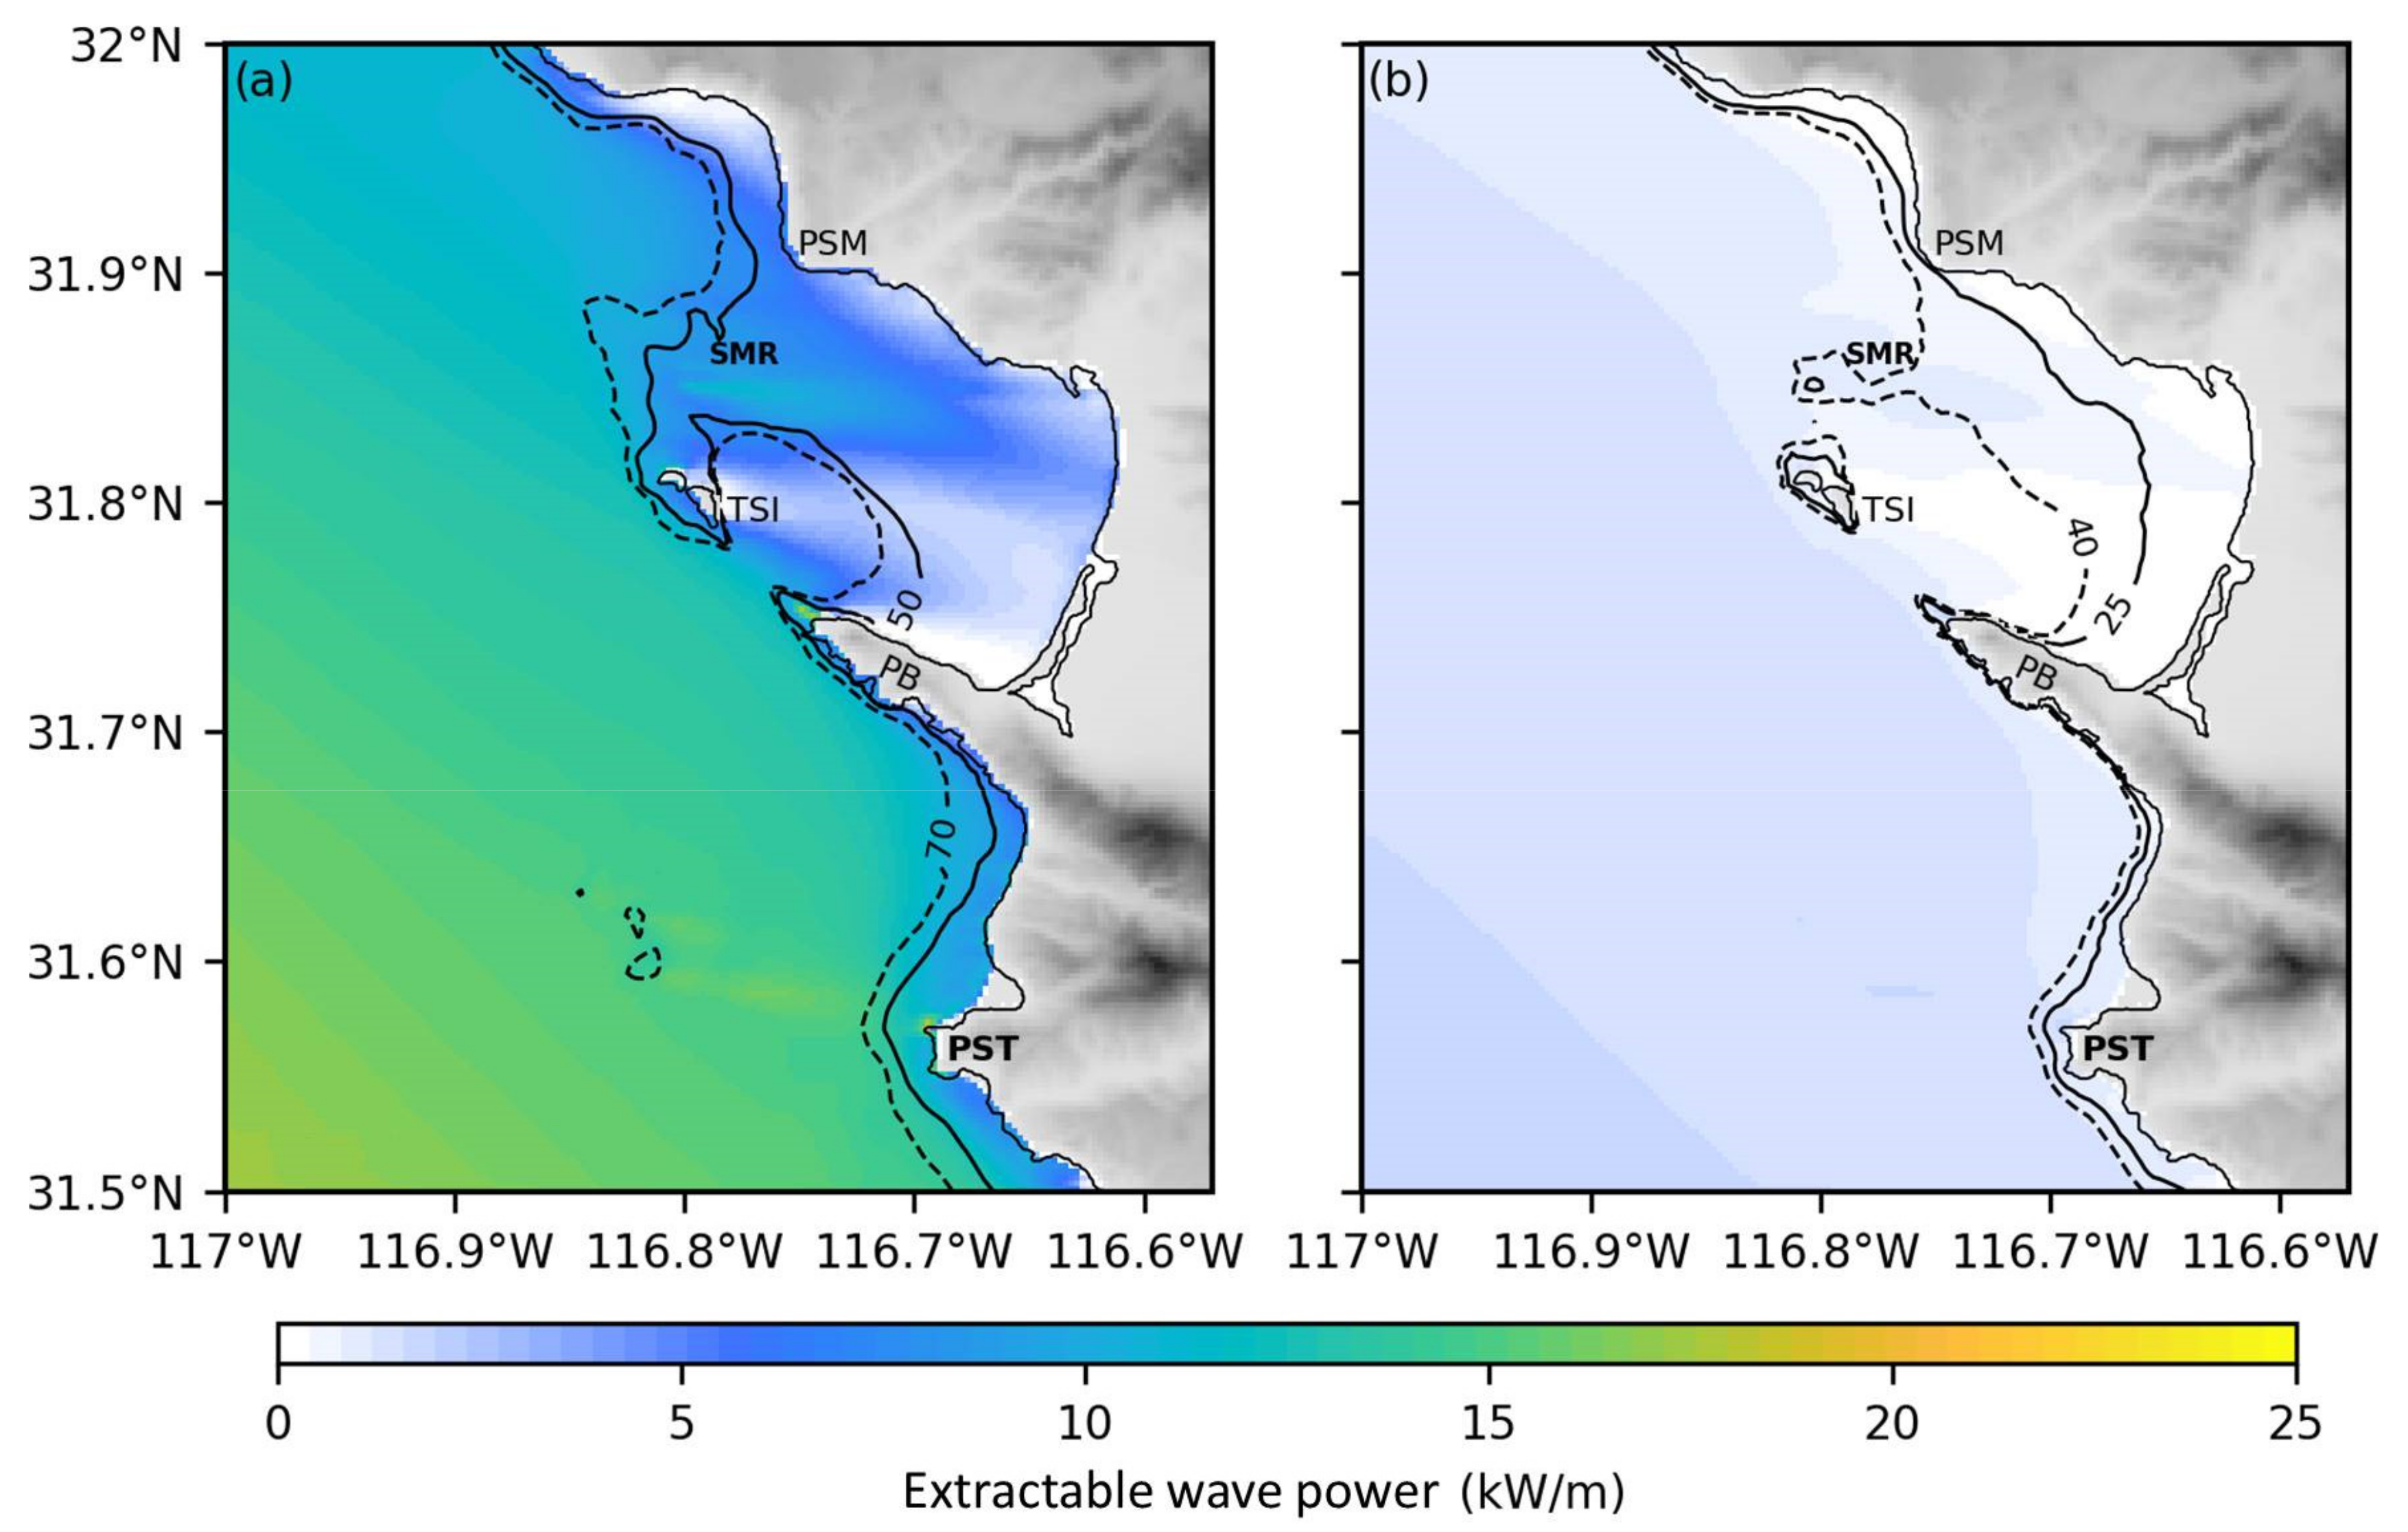
3.3. Harvestable Wave Power

The mean monthly wave power harvested with the analyzed WECs shows a marked seasonality at both selected sites, with the highest extractive capacities during winter and the lowest in summer (Figure 6). Outside TSB, at the PST site (Figure 6c,d), the WEC devices show a higher wave power extraction capacity than inside the bay at the SMR site (Figure 6a,b). Furthermore, among all the evaluated devices, Pelamis and WaveDragon harvest the greatest wave power at the deep and shallow locations, respectively, of both hotspot sites. At the PST site, the maximum mean monthly wave power extracted by Pelamis is 216.4 kW in April. There, twice as much wave power is extracted in winter as in summer. At the SMR site, the maximum wave power harvest with Pelamis occurs in February (155.4 kW), with four times more extraction capacity in winter than in summer. On average, WaveDragon extracts 375 kW at the PST site, almost twice the 204 kW extracted at SMR site. The PST site has 2.6 times more extraction capacity in winter than in summer, with a maximum in January, while the SMR site presents an inter-seasonal ratio of 3.1, with a maximum in February.
In terms of its performance, Pelamis has an average monthly capacity factor of 28.9% at the PST site, with a maximum C f of 40.6% and a difference of 18.3% between the winter and summer seasons, while at the SMR site the values are 20.7% and 23.6%, respectively. In contrast, WaveDragon has a lower capacity factor at both sites with a mean monthly C f value of 5.4%, a maximum of 8.3%, and a seasonal C f difference of 4.9% for the PST site. At the SMR site, the values are 2.9%, 4.4%, and 2.9%, respectively.
Figure 7 shows the mean efficiency of Pelamis (a) and WaveDragon (b) throughout the studied region. In this analysis we focus on Pelamis and WaveDragon because they have the highest extractive capacities in the region. As expected, both devices have a higher extractive capacity at the PST site compared to the SMR. Pelamis is 40% more efficient at the PST site than at SMR, while WaveDragon is 82%. In turn, Pelamis is 10.4 times more efficient than WaveDragon at the PST site and 13.7 at the SMR.

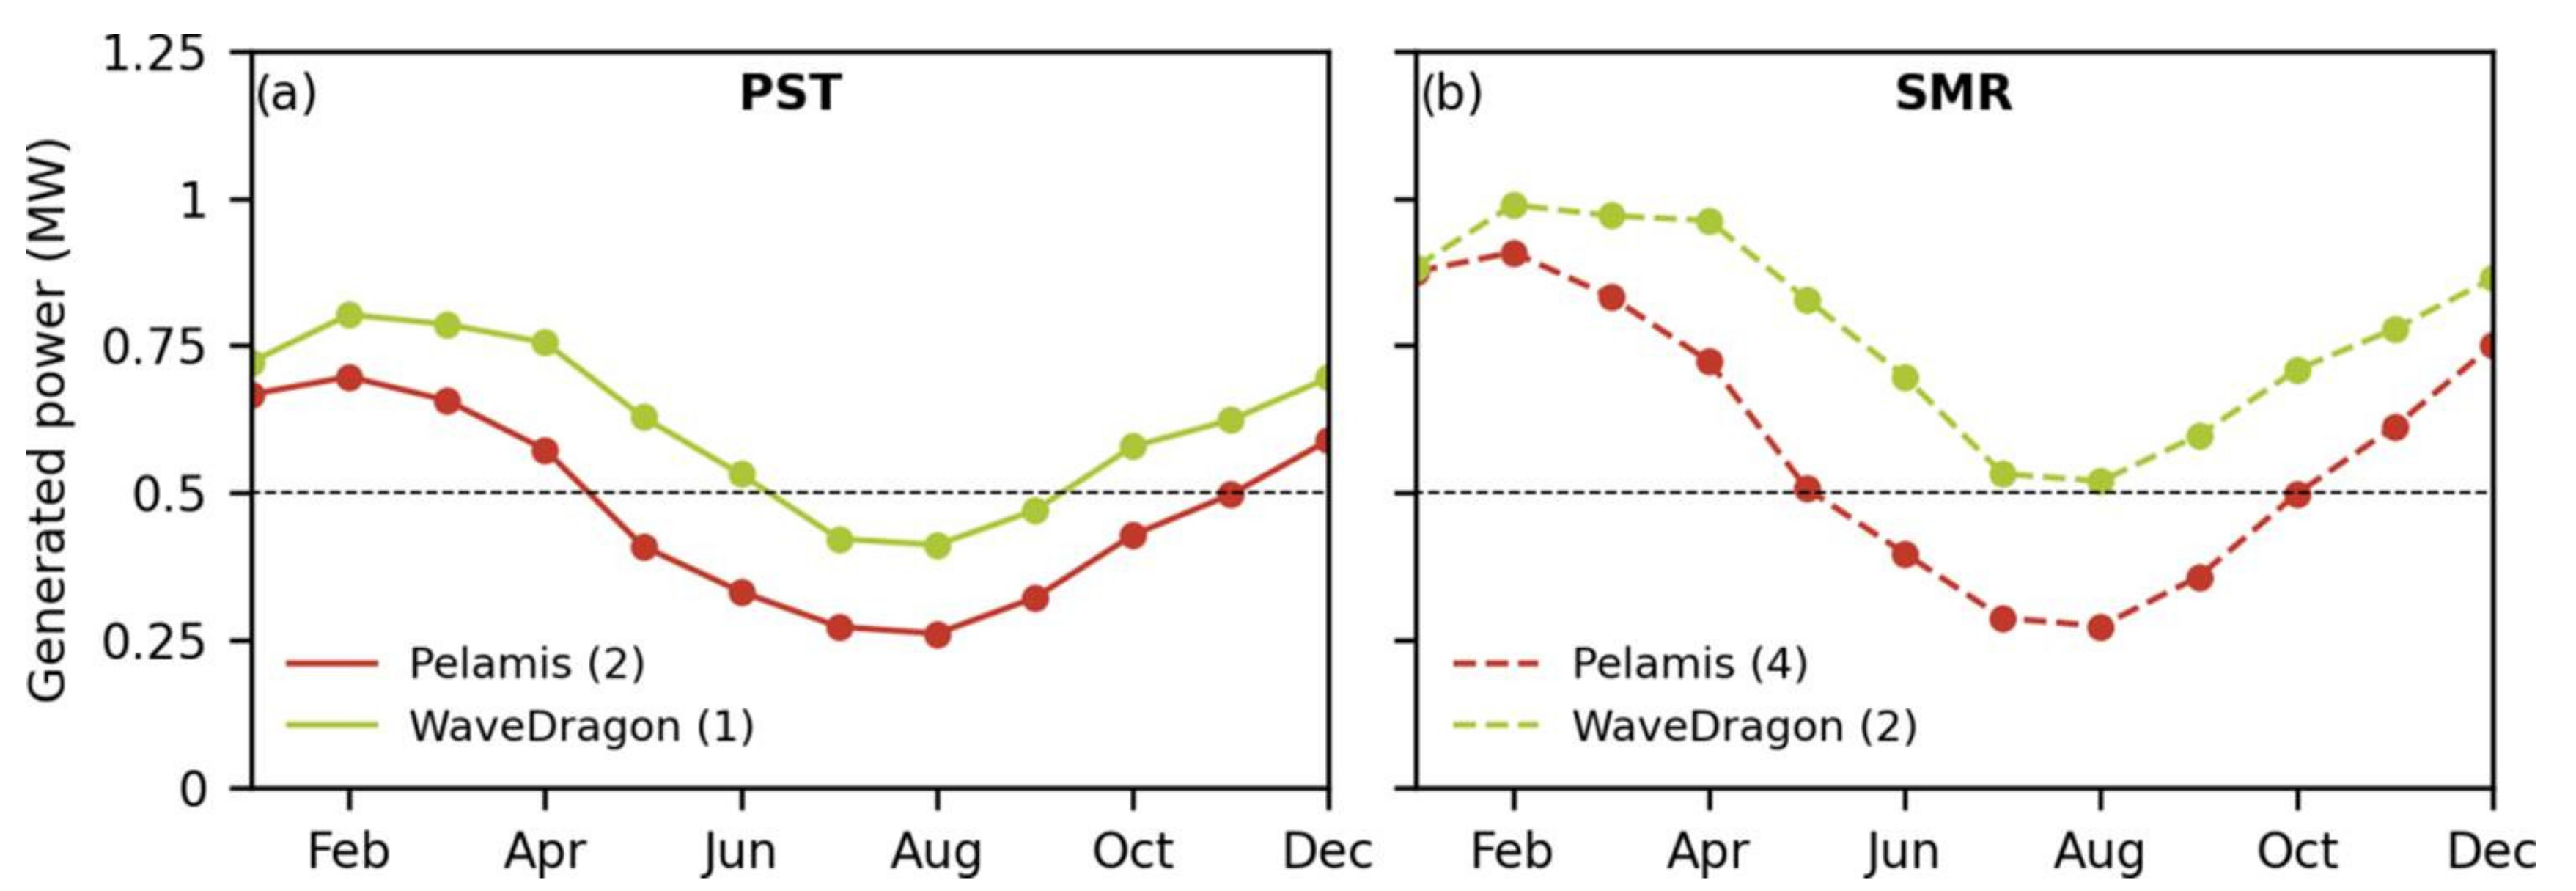
3.4. Wave Power Extracted by WEC Farms Based on a Decentralized Energy Scheme

From previous results, it was determined that to satisfice the regulations of the decentralized energy scheme in Mexico, at the PST site a WEC farm should be composed of two Pelamis or one WaveDragon, while at the SMR site, WEC arrays should have four Pelamis or two WaveDragons.
The monthly climatology of wave power extracted by the minimum number of WECs required to satisfy a DES at the SMR and PST sites is shown in Figure 8. At the PST site, the mean monthly wave power harvested by two Pelamis arrays is 0.5 MW, while a single WaveDragon device produces 0.62 MW. At the SMR site, four Pelamis arrays extract a mean wave power of 0.59 MW, and two WaveDragon arrays harvest 0.78 MW. The extractive capacity of the WEC farms presents a marked seasonality, higher in winter than in summer, which is a consequence of the seasonality of the available wave power. The PST site has lower intra-annual wave power extraction variability than the SMR site. At the PST site, the Pelamis device extracts 148% more power during winter than in summer and WaveDragon 79%. At the SMR site, the difference is about 181% for the Pelamis device and 73% for WaveDragon.

4. Discussion

In the study area, the wave power availability (Figure 3a) has values close to 10 kW·m−1, the minimum needed for commercial-scale wave energy projects [48]. The computed P ¯ availability agrees with the values reported by Ahn et al. [50] for southern California. The moderate wave power of the region is mainly due to its geolocation and the shadowing effect generated by the Southern California Bight (SCB), the California Channel Islands, and the Coronado Islands of Baja California over the incoming swells from the extratropical North Pacific. The highest P ¯ values in the southern area, outside the TSB, are due to the shoreline being more exposed to rougher sea conditions. The P ¯ values increase from south to north because of the effect of the SCB and the groups of islands on incoming swells. The lower P ¯ values inside the TSB are associated with the shadowing effect produced by Todos Santos Island. The high wave power that occurs in the PST and SMR hotspots are the result of bathymetric irregularities. These induce refraction processes that cause convergence of orthogonal wave rays in caustic zones where wave energy is focused, resulting in localized amplification of wave energy and power [51,52]. In the PST, wave focusing is associated with the presence of an offshore shallow ridge and a headland, whereas at the SMR site, it occurs in the leeward side of the offshore reef. The high-resolution bathymetry used in the wave model at a local scale of approximately 280 m allows the observation of coastal formations that induce wave processes and characterize the specific locations where wave energy is focused. The wave power observed outside the TSB is in substantial agreement with that described by Hernández-Fontes et al. [6], who reported an available P ¯ between 10–20 kW·m−1 in northwestern Baja California offshore waters. It is worth mentioning that their estimate was computed with a global wave model with a spatial resolution of 1/8° and, therefore, does not include the wave power spatial variability induced by bathymetric features smaller than 10 km, which are very important in coastal areas, as observed in the present work.
Regarding resource persistence, in agreement with Guillou et al. [53], the most energetic PST and SMR sites are characterized by higher CoV values than the rest of the analyzed domain (Figure 3b), which generates a marked variability of the wave power that may affect the extractive capacity and performance of the WECs. Due to the focusing effect on the wave energy, the CoV will be higher at those sites than in the surrounding environment where no focusing effect occurs. However, although the SMR site has lower P ¯ than the PST site, the SMR shallow has the highest CoV value in the domain (Table 2). This is associated with the combination of lower P ¯ within TSB than in the rest of the area and the focusing effect induced by the offshore reef in the SMR site as the PST site. The lower temporal variability of P ¯ within TSB is associated with the shading effect generated by TSI. Thus, the southern region of TSB has a lower and more constant P ¯ than the northern region of TSB.
The wave characterization in the TSB area by Ruiz de Alegría-Arzaburu et al. [35] is consistent with the results of the joint distribution diagrams (Figure 4). The presence of short wave trains is associated with local wave generation and the long wave trains are related to the occurrence of swells arriving from extratropical regions. As expected, the PST site (Figure 4c,d) has more occurrences of higher waves than the SMR site (Figure 4a,b). This is because the PST site is in a relatively more exposed area, and because of the shadow effect generated by TSI over the TSB site.
The seasonal wave regime that predominates in this area has a yearly trend, with higher wave power during the winter due to the presence of North Pacific swells, and low wave power during summer, when the sea state is dominated by swells originating from the extratropical South Pacific region [54,55]. This marked seasonal trend of the wave resource could affect the WEC performances, resulting in low long-term capacity factors [56].
The PST and SMR locations has a mean wave power higher than 10 kW·m−1, with higher values at the PST site than at the SMR site (Figure 3a), making them suitable for energy extraction [48]. Although, in a global context, the PST and SMR locations have a moderate resource availability, their seasonal variability is lower than that observed north of the studied area, in the U.S. Pacific Northwest coastal regions [50]. Thus, the identified hotspots provide a relatively more consistent energy supply that might enhance opportunities for wave energy extraction. However, both PST and SMR sites have CoV values close to or above 1.2, indicating a significant variability [57,58] and reflecting the occurrence of extreme wave power values [53] in the area, which are enhanced at PST and SMR due to wave energy focusing. Low AVI values indicate low inter-annual resource variability and relative regularity in the total P ¯   extracted between years at the selected sites [50]. However, the high SVI values and, to a greater extent, VMI, denote a high monthly and intra-annual P ¯   variability and reflect the sensitivity of wave characteristics to these longer time scales [53]. Based on variability indices, the deep PST location has the most regular P ¯ . In contrast, the shallow location of the SMR has the highest variability indices, indicating higher variability of the resource at all time scales.
The mean extracted power shows a clear seasonal pattern, higher in winter and lower in summer (Figure 6), that reflects the bimodal nature of the wave energy annual cycle in the study area. Although the wave resource has a higher variability at SMR than the PST site (Table 2), in general, the mean monthly extracted wave power of all evaluated WECs varies in a smaller range at the SMR site than at the PST site (Figure 6). This is associated with higher resource availability and the WECs’ specific extractive capacity at the PST site during the more energetic winter months. Among all the WECs evaluated, Pelamis and WaveDragon devices developed the highest extractive capacity at the two selected sites (Figure 6), due to a better response of these devices to the local wave conditions. Likewise, the highest wave power extracted by Pelamis at the PST site is generated in April (Figure 6c) and not during the most energetic months of winter (Figure 5a), as would be expected.
As well as extractive capacity, the WEC capacity factors follow the evolution of the available wave power (not shown). It has been pointed out that the inter-annual variability of the resource can induce changes in the C f between different years [46]. However, the studied region has a low inter-annual resource variability (Table 2); thus, WEC performances are expected to have relatively low fluctuations between the years considered. Although WaveDragon appears to be the most attractive technology for deployment because it generates the highest mean extracted wave power (Figure 6), Pelamis has more than ten times higher efficiency at the PST and SMR sites (Figure 7). Despite the reduced WaveDragon efficiency, it has a more consistent C f between the winter and summer seasons than Pelamis, which could be of interest to reduce the electricity intermittency generated at both selected sites. This demonstrates the need to continue the design and adaptation of new generations of WECs that are more efficient under moderate wave conditions [59].
To contextualize the results obtained with other regions of potential interest, Table 3 presents a comparative summary of the wave resource availability and productivity (expressed in their performances) of Pelamis and WaveDragon. C f is used as a measure of the technical feasibility for deployment of WECs [53] at three regions with different P ¯ : the Aegean Sea (Greek region, GR), British Columbia (Canada, CAN), and western Brittany (France, FR) [41,46,60]. It can be observed that, despite the fact that the selected sites in Baja California possess lower P ¯ than the Canadian and French regions, Pelamis has higher C f values than the rest of the analyzed regions. This may be associated with greater intra-annual, seasonal, and monthly variability at GR, CAN, and FR. This is related to an improved use of the Pelamis device, in terms of energy production, in PST and SMR. In contrast, it can be observed that, regardless of P ¯ , WaveDragon has a higher C f in GR, CAN, and FR, as compared with the selected sites in Baja California. This demonstrates that WaveDragon is an unsuitable technology to be implemented in the study area. It is a device designed to extract power from highly energetic swells, which reduces its performance in regions with moderate resources. From a technical perspective, the high C f of Pelamis in the study area, especially at the PST site, denotes greater adaptability of this technology to the local climatology than in other analyzed regions. This creates an opportunity area for installing Pelamis devices to harness wave energy in the Baja California peninsula.
Although a complete analysis of techno-economic feasibility is beyond the scope of this paper, a preliminary economic comparison between WECs can inferred using C f as a proxy for the Levelized Cost of Energy (LCoE) [53]. The LCoE relates the total project capital cost expenditures (CapEx, such as cost of construction, mooring lines, underwater and underground power cable, electrical substations), operating and maintenance (OpEx), and annual energy production (expressed in $/MWh), all values expressed in present values [61]. Since annual energy production is a major parameter that determines the LCoE behavior and, in turn, is related to it, it can be inferred that the devices most adapted to the local climatology (generating higher productivity) will be those that obtain lower LCoE [59]. Therefore, considering capital cost expenditures and OpEx of similar ranges between devices and sites, it can be preliminarily determined that the Pelamis device will generate the lowest LCoE values in the selected sites. However, it is recommended to strengthen this analysis with techno-economic feasibility studies that include CapEx and OpEx, adapted to local needs and conditions, to continue promoting the opportunity to install Pelamis devices to harness wave energy in the Baja California peninsula. However, future robust techno-economic feasibility studies that include CapEx and OpEx, adapted to local needs and conditions, are recommended.
Ensuring the leap to commercial scale and higher penetrability in the domestic electricity market requires that the techno-economic feasibility of WEC projects be addressed equally in terms of their commercial readiness and economic viability [62]. Innovation and adaptation of WECs to local wave climatology (higher TPL) will generate a higher stage of development (higher TRL). Achieving project commercialization will lead to a reduction in associated costs and LCoE [61]. Consequently, wave energy will experience a higher level of competition and inclusion within the electricity market that will be reflected by a higher installed capacity within the national renewable pool. Public policies are a crucial instrument to meet the requirements of stakeholders [63].
In terms of resource availability, the WEC arrays must be configured with a higher number of devices at the SMR site than at the PST to supply energy through a DES (Figure 8). Also, in terms of extractive capacity developed per device (Figure 6), WEC farms are composed of a higher number of Pelamis devices than WaveDragon devices. This could be an economic advantage for WaveDragon farms, as fewer devices are needed to satisfy the same range of electrical demand; however, we are not considering the cost of each device, nor the operational costs, which are different for WaveDragon and Pelamis. In addition, the placement of nearshore devices, such as WaveDragon, generates a cost reduction associated with a shorter length of underwater transmission cables required for interconnection with the local power grid [45].
The low to moderate extractive capacity developed by individual devices (see Figure 6) or WEC farms (see Figure 8) creates the need to look for alternative electrical schemes that allow greater technical–economic feasibility for electrical supply in Baja California. Opting for traditional centralized system requires further scaling up and increasing the installed capacity of the WEC farms, as well as a more robust local power grid [64,65]. While this could reduce the cost of electricity generation over its lifetime, it would also be associated with increased investment expenditures (requiring a higher number of WECs per farm) and high electrical infrastructure investment in off-grid areas [66,67]. In addition, the increase in production could exceed the local demand during the winter months of higher wave energy availability, while the summer months would also generate a low electricity supply due to the low availability of the resource [68]. Therefore, the DES requirements in Mexico are an attractive option for WEC farms with small-scale installed capacities (less than 0.5 MW) to satisfy electricity needs in the coastal zone [31,63].
As shown in Figure 8 and the AVI (Table 2), the expected electrical power to be supplied by each WEC farm is less variable at the PST site than at the SMR. However, the seasonal variability of wave power may generate problems in the consistent ability to operate smoothly and safely in the local power grids [69].
As can be seen in Figure 8, for the DES generation capacity of 0.5 MW, the Pelamis farm at the PST site extracts an average power surplus equal to 0.22 MW in winter and a power deficiency of 0.21 MW in summer. In comparison, the SMR site extracts a mean power surplus of 0.37 MW in winter and a deficit of 0.19 MW in summer. The WaveDragon at the PST and SMR sites extracts a mean wave power surplus equal to 0.27 MW and 0.45 MW, respectively, during the winter season, while the PST site only has a power deficiency equal to 0.07 MW during summer. Exceeding 0.5 MW of power on a high percentage of days may indicate that it is more appropriate for WEC farms to require another electricity scheme, such as the Wholesale Electricity Market, that accepts plants from 0.5 MW and above [65]. On the other hand, if the average daily generation is well below 0.5 MW, it will be a relevant factor in determining other sites for WEC farms. Coupling WECs with hybrid systems using conventional renewable energy sources and including energy storage support could be suitable complements to meet a constant electricity supply all year long [70]. This would provide greater flexibility to the power system and help to increase the economic feasibility of the WEC farm project [71,72,73,74]. It is worth noting that the extracted power with the WEC farms computed here does not consider electrical losses due to transmission, nor the electrical consumption of the farm facilities. It is recommended in future works to include the daily and seasonal demand profile of the selected sites in the analysis to strengthen demand side management.
Regarding the energy needs of the selected sites, the PST rural area lacks grid interconnection, while the SMR site is relatively close to an electrical substation in the city [67,68]. Thus, the PST site has greater electrical infrastructure deficiencies and needs than the SMR area. Therefore, the deployment of DES projects could generate more noticeable benefits at the PST site than at SMR. The development of wave energy prosumer enterprises, through a DES scheme, could meet the energy needs of the PST site and, in turn, foster the development of new local opportunities that would improve the welfare of this remote coastal community [75,76,77]. However, in the absence of a robust power grid, the construction of new transmission lines in the PST area can be costly and plagued by siting issues and delays. SMR, on the other hand, could take advantage of existing power lines, which would reduce associated capital costs. In addition, DES deployment could guarantee power supply at both sites when the conventional power grid goes down.
According to the wave power extracted by the different WEC farms (Figure 8), the Pelamis device could satisfy a daily energy demand of approximately 93 households (313 people) at the PST site and 114 houses (383 people) at the SMR site. WaveDragon could support the electrical needs of 120 homes (405 people) at the PST site and 151 households (509 people) at the SMR site, considering an average daily consumption of 4.05 kWh and 3.4 persons per household in the city of Ensenada, Baja California [68].
Local autonomy efforts are related to active community participation [29]. Therefore, energy autonomy is considered an effective tool on the way to the sustainable development of communities. This is especially reflected in the rural area of the PST, which could foster its local development. In turn, harnessing renewable wave energy through DES offer a green and sustainable answer that reduces greenhouse gas emissions to the atmosphere. Furthermore, the siting of DES requires decentralized companies to build, operate, and maintain the facilities, which creates opportunities for job creation and economic benefit for local businesses. This would help increase access to better quality electricity services and electricity independence, improve coastal community resilience, reduce energy poverty, and strengthen national energy security [67,78]. Therefore, the concept of energy autonomy could be considered an effective tool to promote sustainable development in the communities of both selected sites [30].
While DES is capable of offering several potential benefits, it also presents different challenges. The management of Mexico’s electricity market by the State can generate institutional, legal, and administrative barriers that hinder the development of DES by supporting traditional centralized electricity generation schemes. The increase in the number of DES projects requires a degree of energy market diversification with policies that support the participation of local governments, community cooperatives, and private companies in the production and distribution of electricity [26]. Strategies that incentivize the use of renewable sources should be promoted through electricity tariffs that take into account not only the cost of electricity production from the unit or system, but also the capacity and willingness of users to pay [29]. Concerning the technical challenges, adequate planning is necessary to ensure that the deployment of DES does not cause instability in the voltage profile of electricity demand and its supply quality. In addition, power system operation criteria must be redesigned and modernized to facilitate the development of emerging technologies such as smart grids, renewable energies, and energy storage. The financial challenges are associated with a higher capital cost per kW than in large plants. In addition, due to the stability problems that DES systems can present, increased grid integration and operation costs must be considered [28].
Considering the potential conflicts that the WEC facility could cause by coexisting with the diverse economic activities, human use, and existing exclusion zones in the coastal zone, PST appears to be the most suitable site for the WEC facility, since it is located in a remote rural area, where only agricultural and fishing activities occur. On the contrary, the SMR site is located in a highly populated coastal area inside the TSB (Figure 1), where a higher number of activities and coastal uses coexist, such as port, shipping, industrial, tourism, agriculture, fishing, and aquaculture; which may hinder the placement of the WEC within the bay and, in turn, could affect the welfare of local communities and cause conflicts between stakeholders [45,79].
Wave energy extraction projects should determine the possible effects of WEC farm facilities on the marine environment. The farm design should minimize their potential impact on coastal circulation, morphodynamics [24], and biota [23]. These studies are far beyond the scope of the present work, but are being undertaken as a next step along with a complete economic feasibility study.

5. Summary and Conclusions

This study presents a characterization of the wave energy resource and an assessment of WEC farms’ performance that satisfy a DES in the coastal region of Baja California, México. The wave power availability is determined using 11 years of high-resolution wave hindcast made with the SWAN spectral model. Wave simulations have been validated with ADCP measurements, showing good agreement and increasing confidence in the results. Based on the results, the study area has several sites suitable for wave energy extraction. The domain presents a moderate P ¯ availability with a mean annual value close to 10 kW·m−1.
Hotspots in the studied region are due to wave focusing caused by wave refraction over bathymetric features such as reefs, ridges, and headlands. These results further show the importance of using numerical wave simulations and bathymetric data with high resolution, such as those used in this study, for wave energy assessment in coastal seas. The most appropriate locations for wave energy extraction are identified through hotspots of maximum availability and lower temporal variability of the resource. The PST and SMR sites present the highest mean availability of the wave resource, the former being higher than the latter. At both sites, the most common waves have H s between 0.75 m and 1.25 m, and T p of 12−14 s, with a higher occurrence of extreme events in the outer TSB locations. Although, as expected, the deep PST location is more energetic than the shallow location, the shadowing effect of the TSI and the focusing effect of the reef cause the shallow SMR location to have higher P ¯ than the deeper SMR location. There is considerable temporal P variability in the analyzed domain, where both selected sites have lesser inter-annual than intra-annual variability. The highest wave power occurs during winter and the lowest in the summer months. The maximum wave power at the PST and SMR sites are close to 25 kW·m−1 and 17.5 kW·m−1, respectively. Considering the higher availability and lower temporal variability of the resource, the deep location of PST is the most suitable for extracting wave power and developing, preliminarily, the WEC project in the analyzed domain.
In addition to determining the wave conditions, numerical wave models allow the estimation of the wave power extracted and WEC performance at specific locations. The generation capacities of the analyzed WECs show a similar trend to P ¯ , higher at the PST site than at SMR during the winter season. Among all the devices evaluated, WaveDragon and Pelamis extract the highest wave power at the selected shallow and deep locations, respectively. WaveDragon extracts more energy than Pelamis. However, Pelamis is 10.4 times more efficient at the PST site and 13.7 at the SMR site. Thus, Pelamis appears to be the most attractive technology to implement in WEC development because it is the best adapted to the local wave climatology, producing the highest capacity factors at the selected sites. Although Pelamis generates a maximum C f of 40.6%, its lower annual average value reflects the need to continue the development and innovation of a new generation of WECs that better adapt to wave conditions with moderate wave power availability, such as those found in the subtropical region of Baja California, Mexico.
WEC farms, designed to satisfy a DES, require fewer devices at the PST site than at the SMR site. Given the seasonal variability of the wave power extracted by WEC farms in the region, energy storage modules or support with hybrid renewable systems could be suitable complements to satisfy a constant power supply during the less energetic summer months. The WEC farm facility may produce a significant impact on nearshore wave characteristics and on the environment. Detailed studies are required to assess the effects of WEC farms on the near-field and nearshore wave climate, currents, and sediment transport, as well as possible conflicts with other activities existing in the marine coastal zone.

Author Contributions

Conceptualization, H.G.-N. and E.G.-P.; methodology, E.G.-P. and H.G.-N.; software, M.L., H.G.-N., E.G.-P. and M.G.J.-T.; validation, M.G.J.-T. and E.G.-P.; formal analysis, M.L., H.G.-N., E.G.-P. and M.G.J.-T.; investigation, E.G.-P., H.G.-N. and M.G.V.-Z.; resources, H.G.-N.; writing—original draft preparation, E.G.-P. and H.G.-N.; writing—review and editing, M.L., H.G.-N., E.G.-P., M.G.J.-T. and M.G.V.-Z. All authors have read and agreed to the published version of the manuscript.

Funding

This research was funded by the Fondo Sectorial CONACYT-SENER-Sustentabilidad energética, project 249795. This is a contribution of the Centro Mexicano de Innovación en Energía del Océano (CEMIE-Océano).

Institutional Review Board Statement

Not applicable.

Informed Consent Statement

Not applicable.

Data Availability Statement

Not applicable.

Acknowledgments

The IOWAGA wave hindcast data, used as boundary conditions for our regional wave hindcast, were developed by the French Research Institute for Exploitation of the Sea (IFREMER) and are available online at http://wwz.ifremer.fr/iowaga/ (last access: 10 November 2021).

Conflicts of Interest

The authors declare no conflict of interest.

References

  1. Masson-Delmotte, V.; Zhai, P.; Pirani, A.; Connors, S.L.; Péan, C.; Berger, S.; Caud, N.; Chen, Y.; Goldfarb, L.; Gomis, M.I.; et al. IPCC, 2021: Summary for Policymakers. In Climate Change 2021: The Physical Science Basis. Contribution of Working Group I to the Sixth Assessment Report of the Intergovernmental Panel on Climate Change; Yu, R., Zhou, B., Eds.; Cambridge University Press: Cambridge, UK, 2021; In Press. [Google Scholar]
  2. Vega de la Mora, L.A.; Angeles-Camacho, C.; Melchor Quinto, A.Y. Introduction. In Redes Eléctricas: Mercado Mayorista de Electricidad en México. Estado del Arte; Silva Casarín, R., Posada Vanegas, G., Gutiérrez Lara, J., Felix Delgado, A., Eds.; CEMIE-Océano: Universidad Autónoma de Campeche: Campeche, Mexico, 2019; p. 105. ISBN 9786078444281. [Google Scholar]
  3. International Energy Agency (IEA). Global Energy & CO2 Status Report (2018); IEA: Paris, France, 2019. [Google Scholar]
  4. International Renewable Energy Agency (IRENA). Global Energy Transformation: A Roadmap to 2050, 2019th ed.; IRENA: Abu Dhabi, United Arab Emirates, 2019. [Google Scholar]
  5. Poullikkas, A. Technology Prospects of Wave Power Systems. Electron. J. Energy Environ. 2014, 2, 47–69. [Google Scholar] [CrossRef]
  6. Hernández-Fontes, J.V.; Felix, A.; Mendoza, E.; Cueto, Y.R.; Silva, R. On the marine energy resources of Mexico. J. Mar. Sci. Eng. 2019, 7, 191. [Google Scholar] [CrossRef] [Green Version]
  7. Dicorato, M.; Forte, G.; Pisani, M.; Trovato, M. Guidelines for assessment of investment cost for offshore wind generation. Renew. Energy 2011, 36, 2043–2051. [Google Scholar] [CrossRef]
  8. Quitoras, M.R.D.; Abundo, M.L.S.; Danao, L.A.M. A techno-economic assessment of wave energy resources in the Philippines. Renew. Sustain. Energy Rev. 2018, 88, 68–81. [Google Scholar] [CrossRef]
  9. Ilyas, A.; Kashif, S.A.; Saqib, M.A.; Asad, M.M. Wave electrical energy systems: Implementation, challenges and environmental issues. Renew. Sustain. Energy Rev. 2014, 40, 260–268. [Google Scholar] [CrossRef]
  10. Kempener, R.; Neumann, F. Wave Energy: Technology Brief; IRENA: Abu Dhabi, United Arab Emirates, 2014. [Google Scholar]
  11. Sannasiraj, S.A.; Sundar, V. Assessment of wave energy potential and its harvesting approach along the Indian coast. Renew. Energy 2016, 99, 398–409. [Google Scholar] [CrossRef]
  12. Gleizon, P.; Campuzano, F.; Carracedo, P.; Martinez, A.; Goggins, J.; Atan, R.; Nash, S. Wave Energy Resources Along the European Atlantic Coast. In Marine Renewable Energy; Yang, Z., Copping, A., Eds.; Springer: Cham, Switzerland, 2017; ISBN 978-3-319-53534-0. [Google Scholar]
  13. Mustapa, M.A.; Yaakob, O.B.; Ahmed, Y.M.; Rheem, C.K.; Koh, K.K.; Adnan, F.A. Wave energy device and breakwater integration: A review. Renew. Sustain. Energy Rev. 2017, 77, 43–58. [Google Scholar] [CrossRef]
  14. Aggidis, G.A.; Taylor, C.J. Overview of wave energy converter devices and the development of a new multi-axis laboratory prototype. IFAC-PapersOnLine 2017, 50, 15651–15656. [Google Scholar] [CrossRef]
  15. Cruz, J. Ocean Wave Energy: Current Status and Future Perspectives; Cruz, J., Ed.; Springer Science & Business Media: Berlin/Heidelberg, Germany, 2008; ISBN 9783540748946. [Google Scholar]
  16. AbuBakr, B. Wave and Tidal Energy-State of the Art and What Lies Ahead. In Proceedings of the 13th European Wave and Tidal Energy Conference, Napoli, Italy, 1–6 September 2019. [Google Scholar]
  17. Palha, A.; Mendes, L.; Fortes, C.J.; Brito-Melo, A.; Sarmento, A. The impact of wave energy farms in the shoreline wave climate: Portuguese pilot zone case study using Pelamis energy wave devices. Renew. Energy 2010, 35, 62–77. [Google Scholar] [CrossRef]
  18. Castro-Santos, L.; Garcia, G.P.; Estanqueiro, A.; Justino, P.A. The Levelized Cost of Energy (LCOE) of wave energy using GIS based analysis: The case study of Portugal. Int. J. Electr. Power Energy Syst. 2015, 65, 21–25. [Google Scholar] [CrossRef] [Green Version]
  19. Astariz, S.; Iglesias, G. The economics of wave energy: A review. Renew. Sustain. Energy Rev. 2015, 45, 397–408. [Google Scholar] [CrossRef]
  20. Ahamed, R.; McKee, K.; Howard, I. Advancements of wave energy converters based on power take off (PTO) systems: A review. Ocean Eng. 2020, 204, 107248. [Google Scholar] [CrossRef]
  21. Antonio, F.D.O. Wave energy utilization: A review of the technologies. Renew. Sustain. Energy Rev. 2010, 14, 899–918. [Google Scholar] [CrossRef]
  22. Fadaeenejad, M.; Shamsipour, R.; Rokni, S.D.; Gomes, C. New approaches in harnessing wave energy: With special attention to small islands. Renew. Sustain. Energy Rev. 2014, 29, 345–354. [Google Scholar] [CrossRef]
  23. Martínez, M.L.; Vázquez, G.; Pérez-Maqueo, O.; Silva, R.; Moreno-Casasola, P.; Mendoza-González, G.; López-Portillo, J.; MacGregor-Fors, I.; Heckel, G.; Hernández-Santana, J.R.; et al. A systemic view of potential environmental impacts of ocean energy production. Renew. Sustain. Energy Rev. 2021, 149, 111332. [Google Scholar] [CrossRef]
  24. O’Dea, A.; Haller, M.C.; Özkan-Haller, H.T. The impact of wave energy converter arrays on wave-induced forcing in the surf zone. Ocean Eng. 2018, 161, 322–336. [Google Scholar] [CrossRef]
  25. Atan, R.; Finnegan, W.; Nash, S.; Goggins, J. The effect of arrays of wave energy converters on the nearshore wave climate. Ocean Eng. 2019, 172, 373–384. [Google Scholar] [CrossRef]
  26. El Assri, N.; Chabaa, S.; Lmesri, K.; Ali Jallal, M.; Zeroual, A. Modeling Techniques for Decentralized Energy Systems Applied in Smart Grids. In Proceedings of the E3S Web of Conferences, EDP Sciences, Agadir, Morocco, 22–24 July 2021. [Google Scholar]
  27. Mehigan, L.; Deane, J.P.; Gallachóir, B.P.Ó.; Bertsch, V. A review of the role of distributed generation (DG) in future electricity systems. Energy 2018, 163, 822–836. [Google Scholar] [CrossRef]
  28. Weinand, J.M.; Scheller, F.; McKenna, R. Reviewing energy system modelling of decentralized energy autonomy. Energy 2020, 203, 117817. [Google Scholar] [CrossRef]
  29. International Renewable Energy Agency (IRENA). Innovation Landscape Brief: Market Integration of Distributed Energy Resources; IRENA: Abu Dhabi, United Arab Emirates, 2019. [Google Scholar]
  30. Rae, C.; Bradley, F. Energy autonomy in sustainable communities—A review of key issues. Renew. Sustain. Energy Rev. 2012, 16, 6497–6506. [Google Scholar] [CrossRef]
  31. Secretaría de Energía, SENER. Manual de Interconexión de Centrales de Generación con Capacidad Menor a 0.5 MW, 2nd ed.; Diario Oficial de la Federación (DOF): Ciudad de México, Mexico, 2016. [Google Scholar]
  32. Grigsby, L.L. The Electric Power Engineering Handbook, 3rd ed.; Grigsby, L.L., Ed.; CRC Press: Boca Raton, FL, USA, 2018; ISBN 978-1-4398-56345. [Google Scholar]
  33. Bansal, R. Handbook of Distributed Generation; Bansal, R., Ed.; Springer International Publishing: Cham, Switzerland, 2017. [Google Scholar]
  34. Hecke, J.; Salgado, A.; Gruet, R. Oceans Powering the Energy Transition: Progress through Innovative Business Models and Revenue Supports. In Proceedings of the IRENA Insights Webinar Series, Abu Dhabi, United Arab Emirates, 12 May 2020. [Google Scholar]
  35. Ruiz de Alegría-Arzaburu, A.; Vidal-Ruiz, J.A.; García-Nava, H.; Romero-Arteaga, A. Seasonal morphodynamics of the subaerial and subtidal sections of an intermediate and mesotidal beach. Geomorphology 2017, 295, 383–392. [Google Scholar] [CrossRef]
  36. SWAN Team. SWAN Cycle III Version 41.20AB User Manual; Delft University of Technology, Faculty of Civil Engineering and Geosciences, Environmental Fluid Mechanics Section: Delft, The Netherlands; Delft Academic Press: Delft, The Netherlands, 2006. [Google Scholar]
  37. Rascle, N.; Ardhuin, F. A global wave parameter database for geophysical applications. Part 2: Model validation with improved source term parameterization. Ocean Model. 2013, 70, 174–188. [Google Scholar] [CrossRef] [Green Version]
  38. Cornett, A. A Global Wave Energy Resource Assessment. In Proceedings of the 18th International Offshore and Polar Engineering Conference, OnePetro, Vancouver, BC, Canada, 6–11 July 2008. [Google Scholar]
  39. Silva, D.; Rusu, E.; Soares, C.G. Evaluation of various technologies for wave energy conversion in the Portuguese nearshore. Energies 2013, 6, 1344–1364. [Google Scholar] [CrossRef]
  40. Weinstein, A.; Fredrikson, G.; Parks, M.J.; Nielsen, K. AquaBuOY—The offshore wave energy converter numerical modeling and optimization. In Proceedings of the Oceans’04 MTS/IEEE Techno-Ocean ’04 (IEEE Cat. No.04CH37600), Kobe, Japan, 9–12 November 2004; Volume 4, pp. 1854–1859. [Google Scholar] [CrossRef]
  41. Lavidas, G.; Venugopal, V. A 35 year high-resolution wave atlas for nearshore energy production and economics at the Aegean Sea. Renew. Energy 2017, 103, 401–417. [Google Scholar] [CrossRef] [Green Version]
  42. O’Boyle, L.; Doherty, K.; van’t Hoff, J.; Skelton, J. The value of full scale prototype data-testing oyster 800 at emec, orkney. In Proceedings of the 11th European wave and tidal energy conference (EWTEC), Nantes, France, 6–11 September 2015. [Google Scholar]
  43. Babarit, A.L.; Hals, J.; Kurniawan, A.; Moan, T.; Krokstad, J. Power Absorption Measures and Comparisons of Selected Wave Energy Converters. In Proceedings of the 30th International Conference on Ocean, Offshore and Arctic Engineering, Rotterdam, The Netherlands, 19–24 June 2011; pp. 437–446. [Google Scholar]
  44. Babarit, A. A database of capture width ratio of wave energy converters. Renew. Energy 2015, 80, 610–628. [Google Scholar] [CrossRef] [Green Version]
  45. Kim, C.K.; Toft, J.E.; Papenfus, M.; Verutes, G.; Guerry, A.D.; Ruckelshaus, M.H.; Arkema, K.K.; Guannel, G.; Wood, S.A.; Bernhardt, J.R.; et al. Catching the right wave: Evaluating wave energy resources and potential compatibility with existing marine and coastal uses. PLoS ONE 2012, 7, e47598. [Google Scholar] [CrossRef] [Green Version]
  46. Guillou, N.; Chapalain, G. Annual and seasonal variabilities in the performances of wave energy converters. Energy 2018, 165, 812–823. [Google Scholar] [CrossRef] [Green Version]
  47. Chang, G.; Ruehl, K.; Jones, C.A.; Roberts, J.; Chartrand, C. Numerical modeling of the effects of wave energy converter characteristics on nearshore wave conditions. Renew. Energy 2016, 89, 636–648. [Google Scholar] [CrossRef] [Green Version]
  48. Spaulding, M.L.; Grilli, A.; Damon, C.; Fugate, G. Application of technology development index and principal component analysis and cluster methods to ocean renewable energy facility siting. Mar. Technol. Soc. J. 2010, 44, 8–23. [Google Scholar] [CrossRef]
  49. Krogstad, H.E.; Wolf, J.; Thompson, S.P.; Wyatt, L.R. Methods for intercomparison of wave measurements. Coast. Eng. 1999, 37, 235–257. [Google Scholar] [CrossRef]
  50. Ahn, S.; Haas, K.A.; Neary, V.S. Wave energy resource characterization and assessment for coastal waters of the United States. Appl. Energy 2020, 267, 114922. [Google Scholar] [CrossRef]
  51. Calliari, L.J.; Speranski, N.; Boukareva, I. Stable focus of wave rays as a reason of local erosion at the southern Brazilian coast. J. Coast. Res. 1998, 26, 19–23. [Google Scholar]
  52. Holthuijsen, L.H. Waves in Oceanic and Coastal Waters; Cambridge University Press: Cambridge, UK, 2007; ISBN 978-0521860284. [Google Scholar]
  53. Guillou, N.; Lavidas, G.; Chapalain, G. Wave Energy Resource Assessment for Exploitation—A Review. J. Mar. Sci. Eng. 2020, 8, 705. [Google Scholar] [CrossRef]
  54. Ahn, S.; Neary, V.S. Wave energy resource characterization employing joint distributions in frequency-direction-time domain. Appl. Energy 2021, 285, 116407. [Google Scholar] [CrossRef]
  55. Odériz, I.; Silva, R.; Mortlock, T.R.; Mendoza, E. Climate drivers of directional wave power on the Mexican coast. Ocean Dyn. 2020, 70, 1253–1265. [Google Scholar] [CrossRef]
  56. Rusu, E.; Onea, F. A review of the technologies for wave energy extraction. Clean Energy 2018, 2, 10–19. [Google Scholar] [CrossRef] [Green Version]
  57. Sierra, J.P.; White, A.; Mösso, C.; Mestres, M. Assessment of the intra-annual and inter-annual variability of the wave energy resource in the Bay of Biscay (France). Energy 2017, 141, 853–868. [Google Scholar] [CrossRef] [Green Version]
  58. Sierra, J.P.; Martín, C.; Mösso, C.; Mestres, M.; Jebbad, R. Wave energy potential along the Atlantic coast of Morocco. Renew. Energy 2016, 96, 20–32. [Google Scholar] [CrossRef]
  59. Lavidas, G.; Blok, K. Shifting wave energy perceptions: The case for wave energy converter (WEC) feasibility at milder resources. Renew. Energy 2021, 170, 1143–1155. [Google Scholar] [CrossRef]
  60. Dunnett, D.; Wallace, J.S. Electricity generation from wave power in Canada. Renew. Energy 2009, 34, 179–195. [Google Scholar] [CrossRef]
  61. Chozas, J. International Levelised Cost of Energy for Ocean ENERGY technologies; Ocean Energy Syst: Copenhagen, Denmark, 2015. [Google Scholar]
  62. Babarit, A.; Bull, D.; Dykes, K.; Malins, R.; Nielsen, K.; Costello, R.; Roberts, J.; Ferreira, C.B.; Kennedy, B.; Weberc, J. Stakeholder requirements for commercially successful wave energy converter farms. Renew. Energy 2017, 113, 742–755. [Google Scholar] [CrossRef]
  63. Diezmartínez, C.V. Clean energy transition in Mexico: Policy recommendations for the deployment of energy storage technologies. Renew. Sustain. Energy Rev. 2021, 135, 110407. [Google Scholar] [CrossRef]
  64. Kabalci, E.; Boyar, A.; Kabalci, Y. Centralized power generation. Hybrid Renew. Energy Syst. Microgrids 2021, 47–72. [Google Scholar] [CrossRef]
  65. Diario Oficial de la Federación (DOF). Acuerdo por el que la Secretaría de Energía emite las Bases del Mercado Eléctrico. (Continúa en la Quinta Sección); Ciudad de México, Mexico, 2015. Available online: http://www.dof.gob.mx/nota_detalle.php?codigo=5407715&fecha=08/09/2015 (accessed on 19 June 2020).
  66. Chozas, J.F.; Kofoed, J.P.; Jensen, N.E.H. User Guide—COE Calculation Tool for Wave Energy Converters: Ver. 1.6; Department of Civil Engineering, Aalborg University: Aalborg, Denmark, 2014. [Google Scholar]
  67. Secretaría de Energía, SENER. Regiones sin Electricidad. Available online: http://datos.gob.mx/busca/dataset/regiones-sin-electricidad/resource/f580dd2d-d28e-4c86-a850-acad3f01d4d8 (accessed on 19 June 2020).
  68. INEGI. Anuario Estadístico y Geográfico de Baja California 2017; Instituto Nacional de Estadística y Geografía (INEGI): Aguascalientes, Mexico, 2017. [Google Scholar]
  69. The Happy Neuron. Wave Power Might Be Feasible after All. Available online: http://thehappyneuron.com/2020/05/wave-power-might-be-feasible-after-all/ (accessed on 21 November 2020).
  70. Trikalitis, S.; Lavidas, G.; Kaldellis, J.K. Energy Analysis of a Hybrid Wind-Wave Solution For Remote Islands. Renew. Energy Environ. Sustain. 2021, 6, 34. [Google Scholar] [CrossRef]
  71. Wilson, D.G.; Weaver, W.W.; Bacelli, G.; Robinett, R.D. WEC array electro-mechanical drivetrain networked microgrid control design and energy storage system analysis. In Proceedings of the 2018 International Symposium on Power Electronics, Electrical Drives, Automation and Motion (SPEEDAM 2018), Amalfi, Italy, 20–22 June 2018; pp. 1278–1285. [Google Scholar] [CrossRef]
  72. Roy, A.; Auger, F.; Dupriez-Robin, F.; Bourguet, S.; Tran, Q.T. Electrical power supply of remote maritime areas: A review of hybrid systems based on marine renewable energies. Energies 2018, 11, 1904. [Google Scholar] [CrossRef] [Green Version]
  73. Guneya, M.S.; Tepe, Y. Classification and assessment of energy storage systems. Renew. Sustain. Energy Rev. 2017, 75, 1187–1197. [Google Scholar] [CrossRef]
  74. Friedrich, D.; Lavidas, G. Evaluation of the effect of flexible demand and wave energy converters on the design of hybrid energy systems. IET Renew. Power Gener. 2017, 11, 1113–1119. [Google Scholar] [CrossRef] [Green Version]
  75. Franzitta, V.; Curto, D.; Milone, D.; Viola, A. The desalination process driven by wave energy: A challenge for the future. Energies 2016, 9, 1032. [Google Scholar] [CrossRef] [Green Version]
  76. Stuiver, M.; Soma, K.; Koundouri, P.; Van ben Burg, S.; Gerritsen, A.; Harkamp, T.; Dalsgaard, N.; Zagonari, F.; Guanche, R.; Schouten, J.-J.; et al. The Governance of multi-use platforms at sea for energy production and aquaculture: Challenges for policy makers in European Seas. Sustainability 2016, 8, 333. [Google Scholar] [CrossRef] [Green Version]
  77. Clemente, D.; Rosa-Santos, P.; Taveira-Pinto, F. On the potential synergies and applications of wave energy converters: A review. Renew. Sustain. Energy Rev. 2021, 135, 110162. [Google Scholar] [CrossRef]
  78. García-Ochoa, R.; Graizbord, B. Caracterización espacial de la pobreza energética en México. Un análisis a escala subnacional. Econ. Soc. Territ. 2016, 16, 289–337. [Google Scholar] [CrossRef]
  79. Nelson, P.A.; Behrens, D.; Castle, J.; Crawford, G.; Gaddam, R.N.; Hackett, S.C.; Largier, J.; Lohse, D.P.; Mills, K.L.; Raimondi, P.T.; et al. Developing Wave Energy in Coastal California: Potential Socio-Economic and Environmental Effects; California Energy Commission, PIER Energy-Related Environmental Research Program & California Ocean Protection Council: Sacramento, CA, USA, 2008; CEC-500-2008-083.
Figure 1. Bathymetry and location of the study area in the Baja California peninsula. The triangles and circles are the deep (purple) and shallow (orange) test sites in the hotspots areas of Punta Santo Tomas (PST) and San Miguel Reef (SMR), respectively. The diamonds are the ADCP measuring sites. The yellow diamond corresponds to ADCP 1, the red diamond to ADCP 2, and the blue diamond to ADCP 3. The text legends are Punta San Miguel (PSM), Todos Santos Bay (TSB), Todos Santos Islands (TBI), and Punta Banda (PB). The solid and dashed lines are the isobaths with values expressed in meters.
Jmse 09 01264 g001
Figure 2. Comparison of the significant wave height ( H s ) simulated and observed at ADCP 1 (a), ADCP 2 (b), and ADCP 3 (c) measuring locations. Dashed lines are the 90% confidence limits based on sampling variability.
Jmse 09 01264 g002
Figure 3. Mean available wave power (a) and CoV (b) over the full hindcast period. The selected sites, Punta Santo Tomas (PST) and San Miguel Reef (SMR), are in bold. The solid black lines in (a) represent wave power isolines, expressed in kW·m−1.
Jmse 09 01264 g003
Figure 4. Joint distribution of significant wave height H s and peak period Tp at the deep (a,c) and shallow (b,d) locations of the hotspots in PST (c,d) and SMR (a,b). The color bar represents the percentage of   H R , colored by the total wave power contribution, for each sea state. The dashed lines are isolines of constant wave power in kW·m−1.
Jmse 09 01264 g004
Figure 5. Seasonal mean wave power for the 2008–2018 period. Panel (a) winter season (January to March), (b) spring season (April to June), (c) summer season (July to September), and (d) fall season (October to December). San Miguel Reef (SMR) and Punta Santo Tomas (PST) sites are indicated in bold. The solid lines represent the 5 and 10 kW·m−1 isolines.
Jmse 09 01264 g005
Figure 6. Monthly mean power harvested by the analyzed WECs at the deep (a,c) and shallow (b,d) locations of the PST (c,d) and SMR (a,b) sites.
Jmse 09 01264 g006
Figure 7. Mean efficiency of Pelamis (a) and WaveDragon (b), in terms of the wave power extracted by their respective dimensional widths. Punta Santo Tomas (PST) and San Miguel Reef (SMR) sites are indicated in bold. The solid and dashed lines represent isobaths in meters; the area between isobaths is the area with the optimal operating depth range for each WEC.
Jmse 09 01264 g007
Figure 8. Monthly mean power extracted by WEC arrays at the PST (a) and SMR (b) sites, based on a DES. The number of devices used in each array is shown in parenthesis. The dashed line of 0.5 MW represents the generation capacity required to satisfy a DES.
Jmse 09 01264 g008
Table 1. Comparison of modeled and observed wave characteristics at three different locations within BTS.
ADCPsNo. ObservationsWave ParametersBiasRMSESIr
ADCP 17985 H s 0.05 m0.23 m0.180.92
T p 0.25 s2.74 s0.220.63
ADCP 24557 H s 0.11 m0.22 m0.250.95
T p 0.80 s3.18 s0.300.55
ADCP 326719 H s −0.11 m0.23 m0.230.93
T p 0.11 s2.42 s0.230.72
Statistical values of bias, root mean square error (RMSE), scatter index (SI), and linear correlation coefficient (r) from the comparison of the numerical results and observations when estimating the integral parameters of the wave energy, H s , in meters and Tp in seconds, for the three different ADCP locations within BTS.
Table 2. P ¯ and variability indices at shallow and deep locations of PST and SMR sites.
PSTSMR
ShallowDeepShallowDeep
P ¯ 1315119
CoV 1.21.171.481.22
AVI 0.60.580.660.59
SVI 2.22.082.92.16
MVI 3.743.555.013.61
P ¯ in kW·m−1. CoV , MVI , SVI , and AVI are the coefficient of variation and the annual, seasonal, and monthly variability indices, respectively.
Table 3. Wave resource availability and productivity generated individually by Pelamis and WaveDragon in Baja California and other well-known places in the world.
WECsSites
Baja California Study SiteOther Places in the World
PSTSMR
P ¯ C f P ¯ C f P ¯ C f R e f .
Pelamis1528.9920.710.1
12.3
24.6
10.1
12.3
17.9
11.3
16.3
14.1
13.2
23.9
25.2
GR [41]
CAN [60]
FR [46]
GR [41]
CAN [60]
FR [46]
WaveDragon135.4112.9
Pelamis and WaveDragon are the selected WECs. P ¯ is the average wave power in kW·m−1, C f is the capacity factor in %, and R e f . are the references of the well-known places in the world.
Publisher’s Note: MDPI stays neutral with regard to jurisdictional claims in published maps and institutional affiliations.

