Article

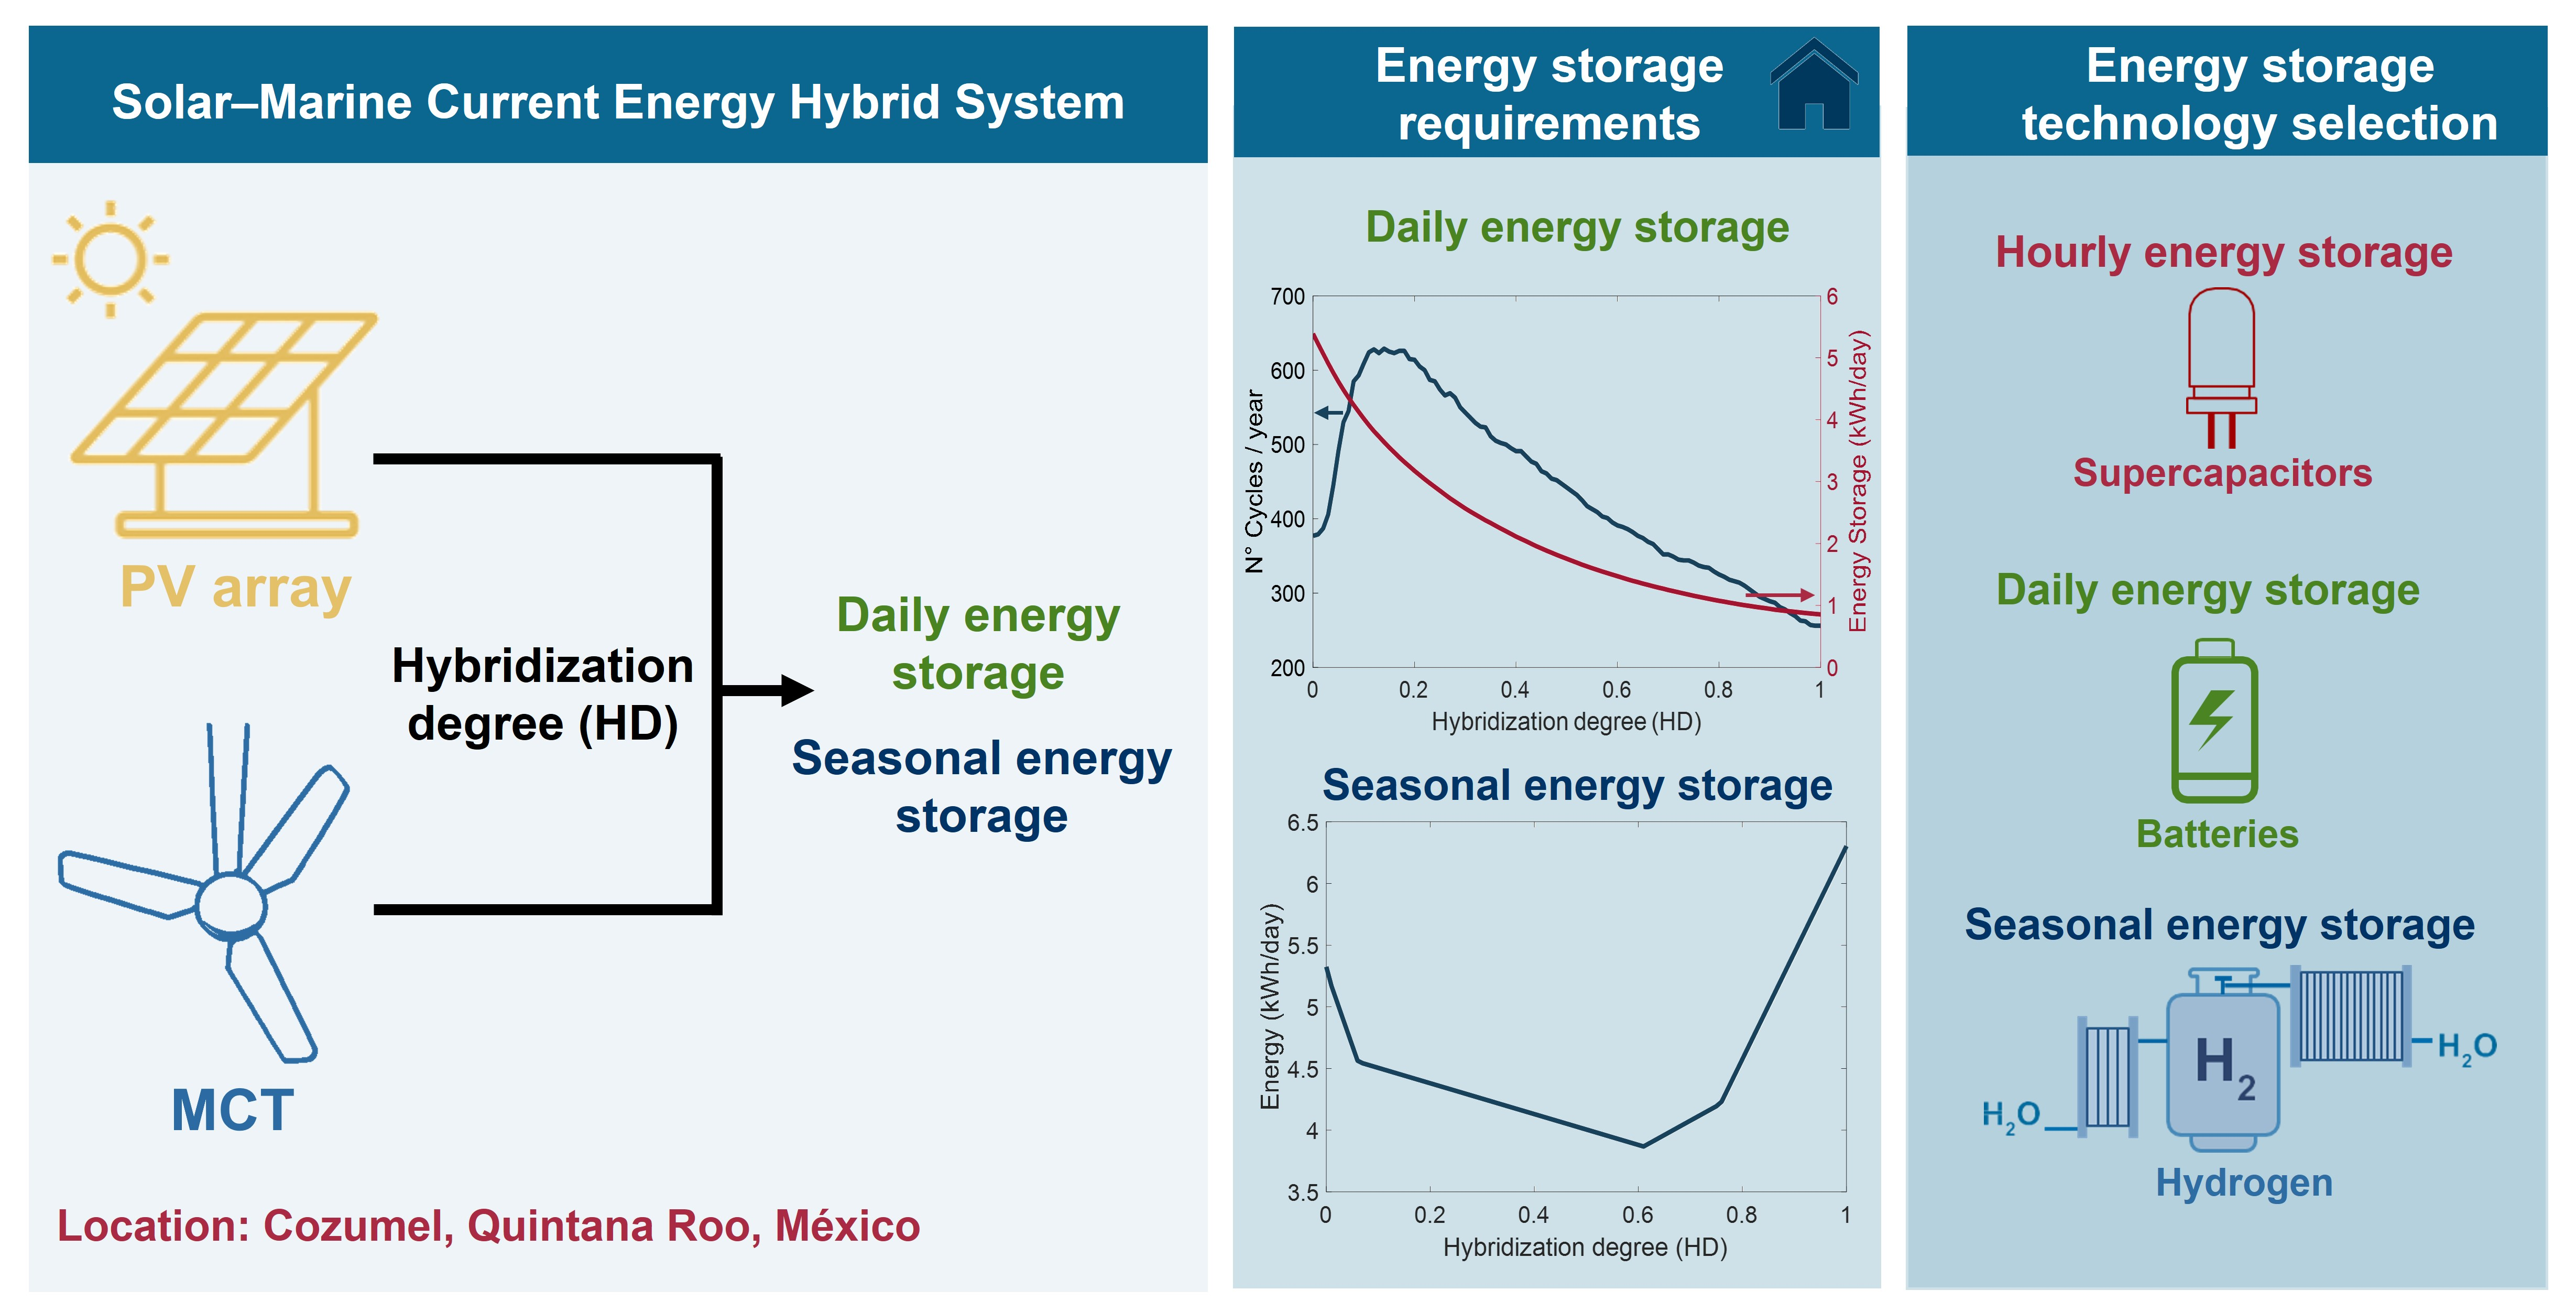
Analysis of Stand-Alone Photovoltaic—Marine Current Hybrid System and the Influence on Daily and Seasonal Energy Storage

by
Jorge Olmedo-González
1,*,
Guadalupe Ramos-Sánchez
2,
Erika Paola Garduño-Ruiz
3 and
Rosa de Guadalupe González-Huerta
1,*
1
Electrochemistry Laboratory, Instituto Politécnico Nacional-ESIQIE, UPALM, Av. Instituto Politécnico Nacional S/N, Mexico City 07738, Mexico
2
Chemistry Department, Universidad Autónoma Metropolitana-Iztapalapa, Av. San Rafael Atlixco 186, Mexico City 09340, Mexico
3
Instituto de Ingeniería, Universidad Nacional Autónoma de México, Ciudad Universitaria, Building 17, Circuito Exterior S/N, Coyoacán, Mexico City 04510, Mexico
*
Authors to whom correspondence should be addressed.
Energies 2022, 15(2), 468; https://doi.org/10.3390/en15020468
Submission received: 23 October 2021 / Revised: 23 December 2021 / Accepted: 2 January 2022 / Published: 10 January 2022
(This article belongs to the Topic Energy Storage and Conversion Systems)

Abstract

:
Stand-alone systems in remote regions require the utilization of renewable resources; however, their natural intermittence requires the implementation of energy-storage systems that allow a continuous power supply. More than one renewable source is usually available at the same site. Thus, the choice of a hybrid system seems viable. It is relevant to study hybrid systems as they could reduce energy storage; however, sizing the hybrid system might have several implications, not only for the available daily energy, but also for the required daily energy storage and surplus seasonal energy. In this work, we present a case study of a stand-alone, conventional household powered by photovoltaic and marine-current-energy systems in Cozumel, Mexico. The analysis of different hybridization degrees serves as a guidance tool to decide whether hybrid systems are required for a specific situation; in contrast to previous approaches, where ideal consumption and generation profiles have been utilized, yearlong profiles were utilized here. The renewable potential data were obtained on site at an hourly resolution; requirements such as size of and cycles in the daily and seasonal energy storage were analyzed according to the degree of participation or hybridization of the proposed renewable systems through an algorithm that evaluates power generation and daily consumption throughout the year. A further analysis indicated that marine-current-energy implementation reduces the size of the daily energy-storage system by 79% in comparison to the use of only a photovoltaic system due to the similarity between the energy-demand profile and the marine-current-energy production profile. The results indicate that a greater participation of marine currents can help decrease daily storage while increasing seasonal storage by 16% compared to using only solar energy. On the other hand, hybridization enabled a reduction in the number of daily charge and discharge cycles at 0.2 hybridization degrees. It also allowed us to reduce the seasonal energy storage by 38% at 0.6 hybridization degrees with respect to only using energy from marine currents. Afterwards, energy-storage technologies were evaluated using the TOPSIS Multi-Criteria Decision Analysis to validate the best-suited technology for the energy-storage system. The evaluation considered the characteristics of the technology and the periods of energy storage. In this work, hybrid storage systems were mandatory since, for daily storage, lithium-ion batteries are better suited, while for seasonal storage, hydrogen-producing systems are more suitable to manage the amount of energy and the storage duration due to the high seasonal renewable-energy variations.

Graphical Abstract

1. Introduction

Sun, wind, and marine energies are defined as Variable Renewable Energies (VREs) due to their inherent intermittence, irregularity, and dispatchability, although VREs might have several small- to large-scale applications in stand-alone power systems where energy storage is essential. Marine Renewable Energy (MRE) is broadly available in different regions. Estimations indicate that ocean energy could contribute from 500 to 1000 MW of the installed capacity by 2030 [1,2]. Ocean currents or marine currents can produce energy from tidal movements and/or ocean circulation due to thermal and salinity gradients [3]. In Mexico, this type of energy is attractive due to its natural occurrence in certain regions such as the Gulf of California and the Cozumel Current in the Yucatan Peninsula where the potential for producing energy is as high as 100 W/m2 [4]. However, even with the technology to harvest ocean energy, significant challenges for renewable energy include bringing the energy into the coast, storing it, and using it in a cost-effective manner.
Stand-alone renewable energy systems are off-grid systems that are able to provide electricity for regions lacking power grids in specific remote applications. Energy supply is usually provided by VREs where the energy-storage systems (ESSs) play a very important role in balancing and controlling the generation and consumption of electricity in deferred periods of time [5]. Nowadays, the cost of energy-storage systems is high; therefore, the selection of an appropriate ESS requires studies with multiple approaches. Determining the correct one among the many options, such as Pumped Hydro Storage (PHS), Compressed Air Energy Storage (CAES), Pb batteries, li-ion batteries, flow batteries, flywheels, supercapacitors, and hydrogen, should be carried out whilst taking into account criteria such as, storage capacity, response time, lifetime, cycle life, efficiency, cost, power, energy density, and power rating [6,7]. These criteria are also important as ESSs may play an important role in the environmental impact of the system [8]. The large variety of options and complex characteristics make it difficult to choose a specific ESS to take full advantage of their properties [9]. Therefore, the first step to deciding the most appropriate ESS technology is to consider its benefits, advantages, disadvantages, and maturity [10]. Moreover, stand-alone systems require a higher degree of energy availability to provide autonomy and comfort related to the daily electricity consumption. Hybrid renewable energy systems could be an effective way to integrate different renewable energy sources, for instance, sun and marine energy sources or any other viable combination. Hybrid systems can provide major electricity-generation availability, improving the reliability of the energy supply and the overall efficiency due to a lower dependency on ESSs [11]. Likewise, they could allow energy-storage-installed capacity to be reduced while having a profound effect on the durability of the ESS since the cycle life is affected by the daily availability of the renewable source [12]. The study of the potential of renewable energies is the first stage of the development of a hybrid system where the analyses in different periods of time, from daily to seasonal, can provide substantial information on the performance and energy storage needs in these periods [13].
Cozumel, Mexico, has been considered as a potential zone for stand-alone systems for households due to its ecotourism attractions. Although many studies of ESS implementation in the main VRE systems (solar and wind energy) can be found elsewhere, only few studies for MRE exist, especially in potential regions of Mexico or other regions with an abundance MRE resources; Figure 1 shows MRE projects where ESSs are considered.
The relevance of incorporating an ESS relies on its inherent environmental and economic benefits, especially in stand-alone systems where the surplus energy can be used for other purposes such as mobility. Stand-alone systems and microgrids are quite promising in Mexico due to approximately two million people having no access to electricity, especially in isolated regions and coastal zones [14]. As MRE and photovoltaic energy are broadly available in coastal touristic zones, this work could serve as a guide for the implementation of hybrid systems where the choice of primary source might have further implications. The different hybridization degrees not only imply continuous household energy supply but also the great benefits of seasonal energy storage, thus providing further economic advantages.
Figure 1. Different MRE projects with ESSs and their use [15,16,17,18,19,20,21,22,23,24].
Energies 15 00468 g001

2. Methods

This paper proposes a case study to evaluate the hybridization degree (HD) of a Solar–Marine Hybrid Energy System (SMHES) in the Cozumel region. The method comprises the following activities: (1) determination of daily and monthly energy storage assessment of the SMHES in the region; (2) comparison of home-load profiles to determine the average energy consumption; (3) identification of the appropriate ESS using Multi-Criteria Decision Analysis (MCDA) with a combination of AHP-TOPSIS methods.

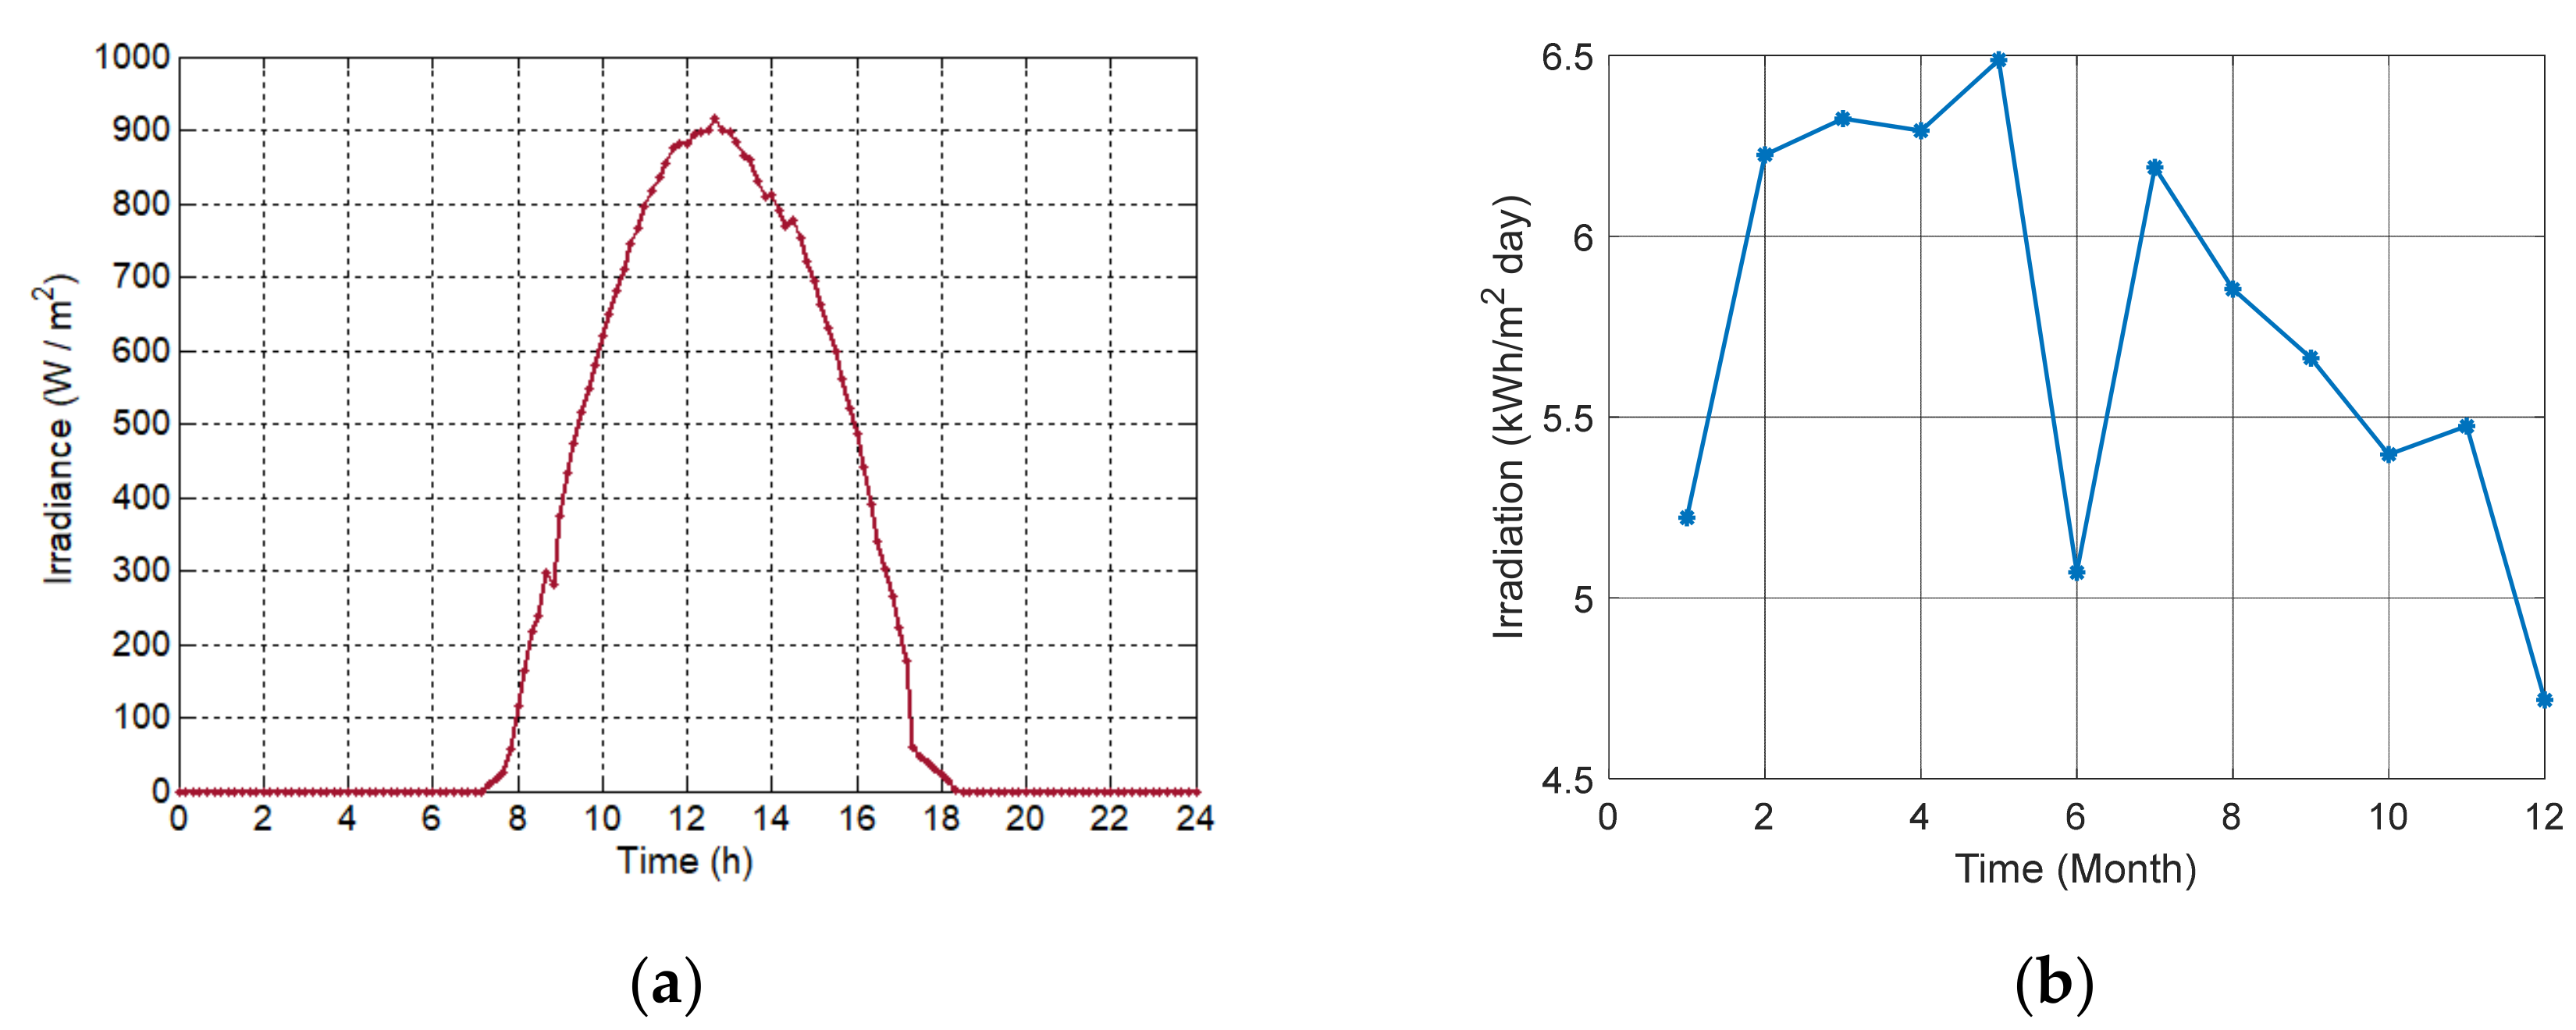
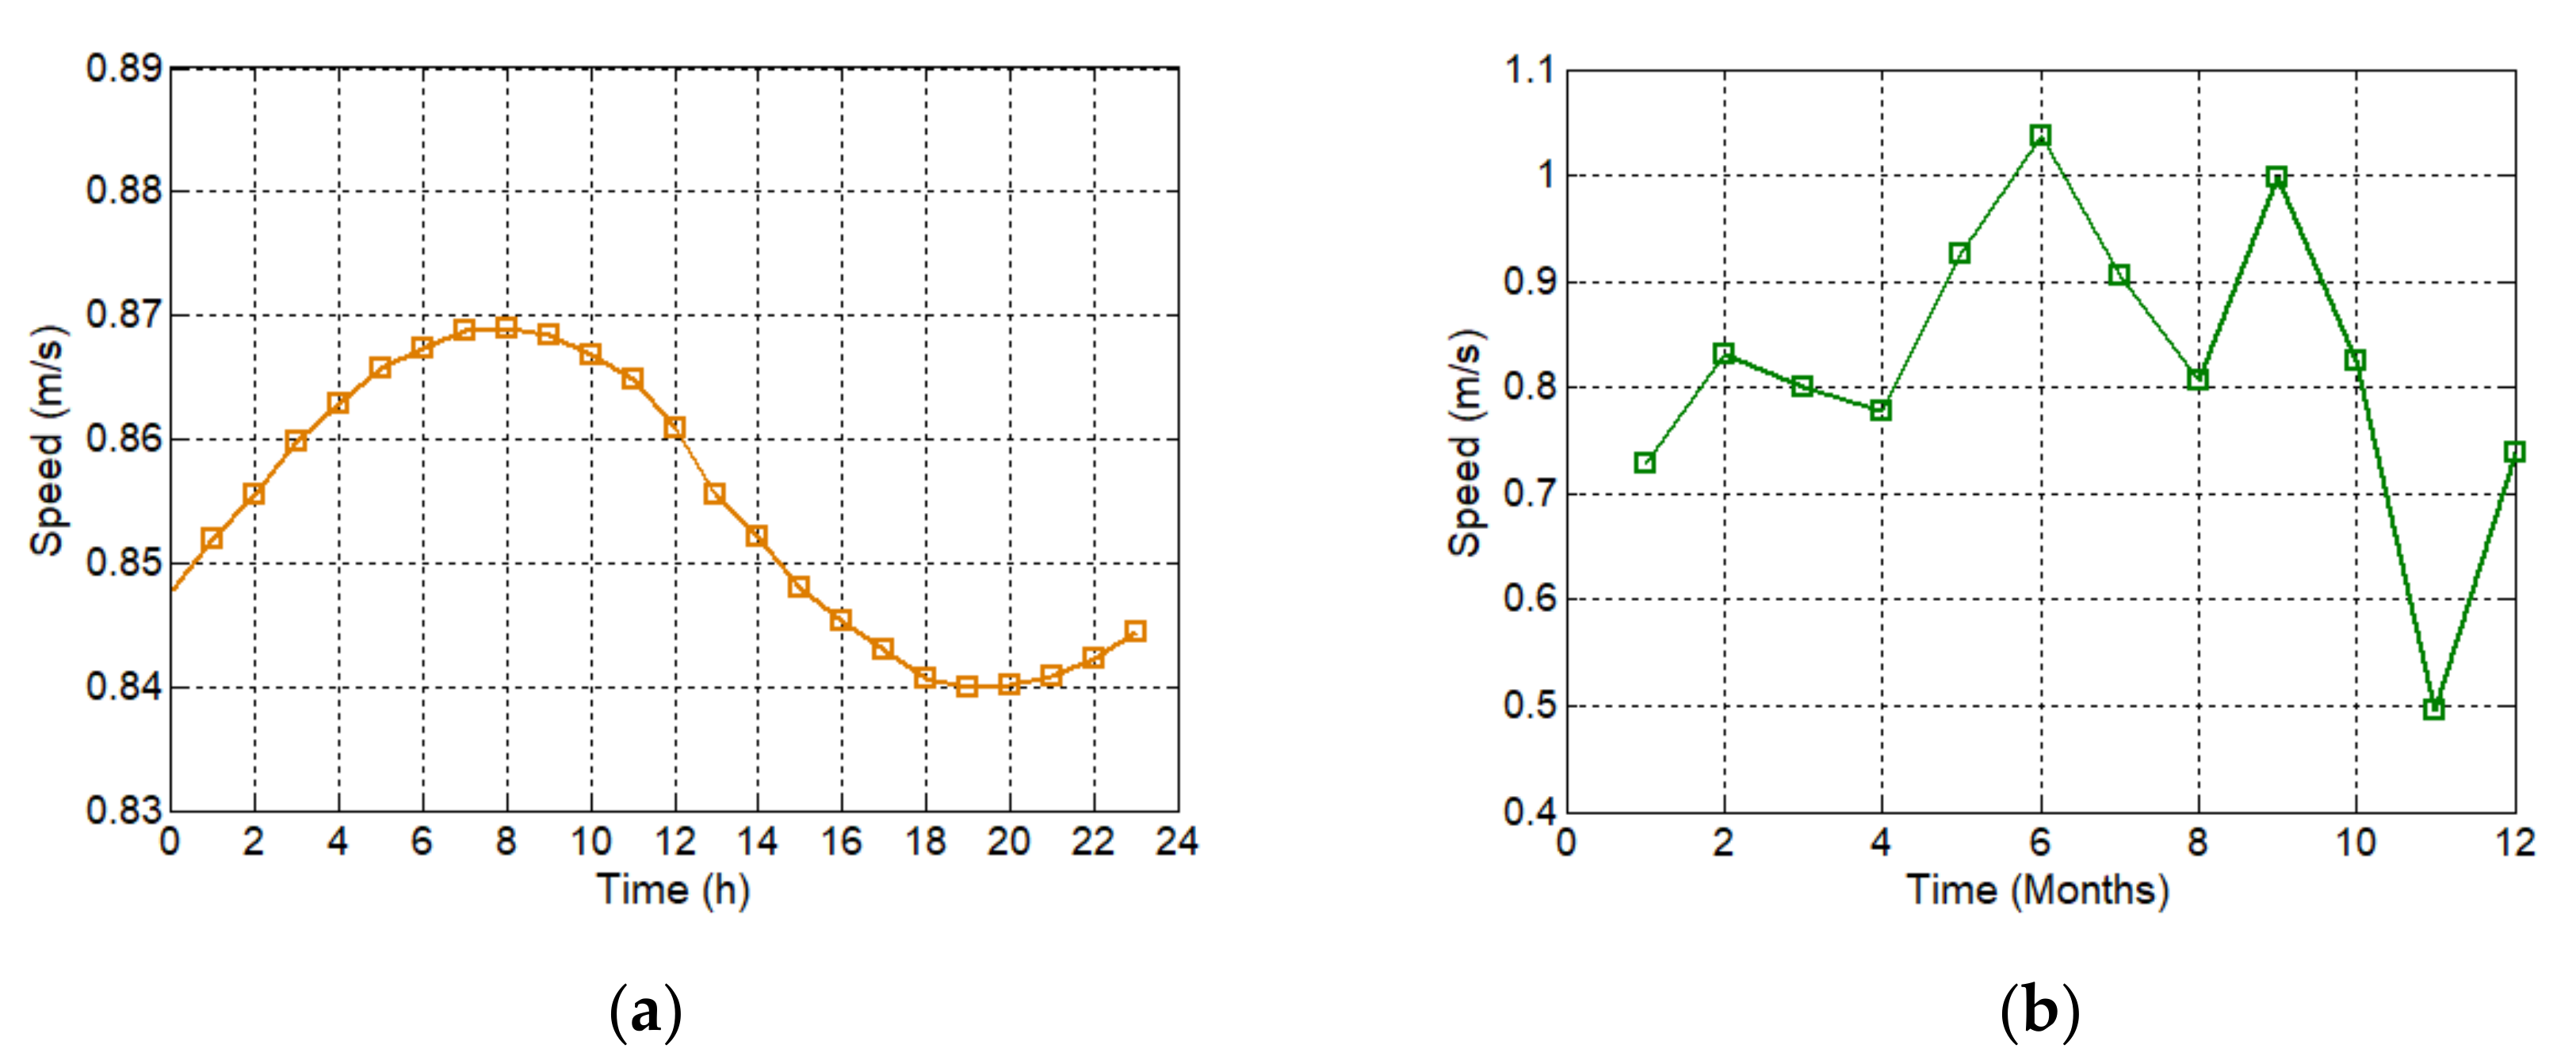
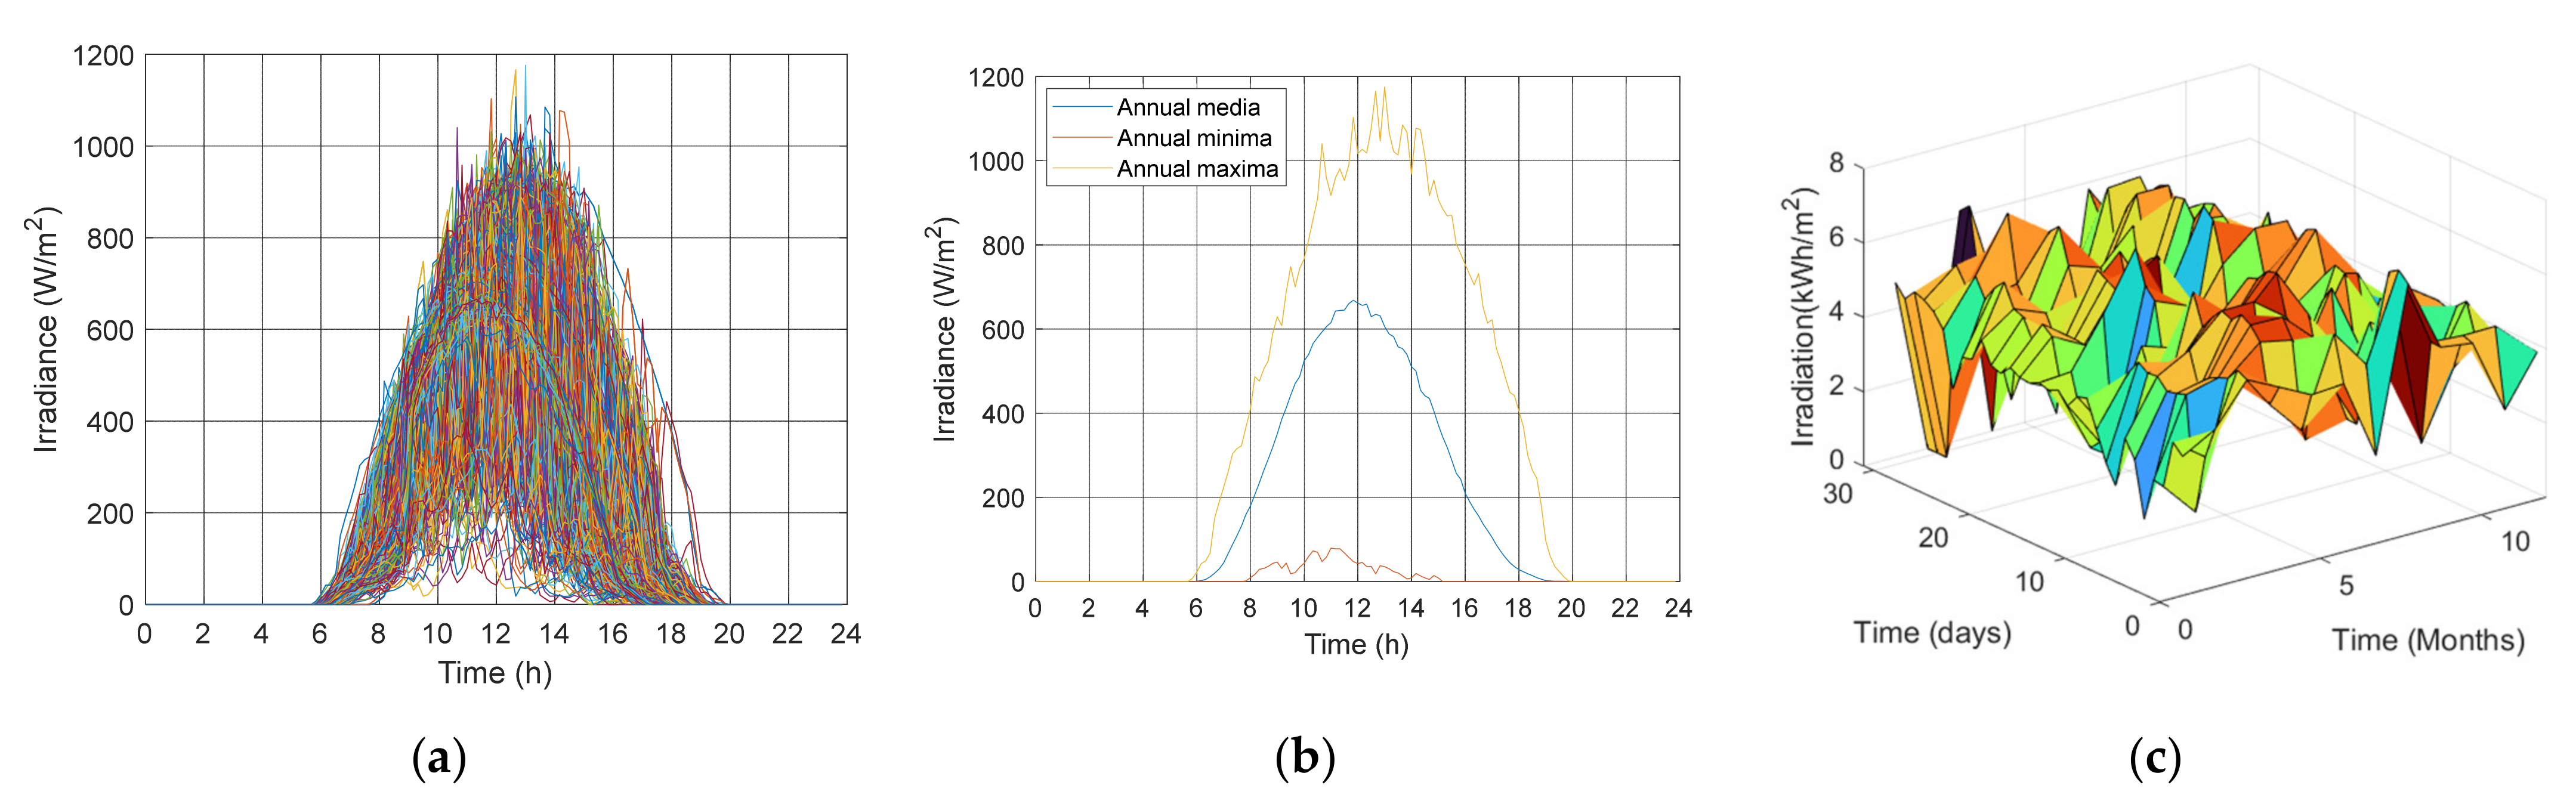
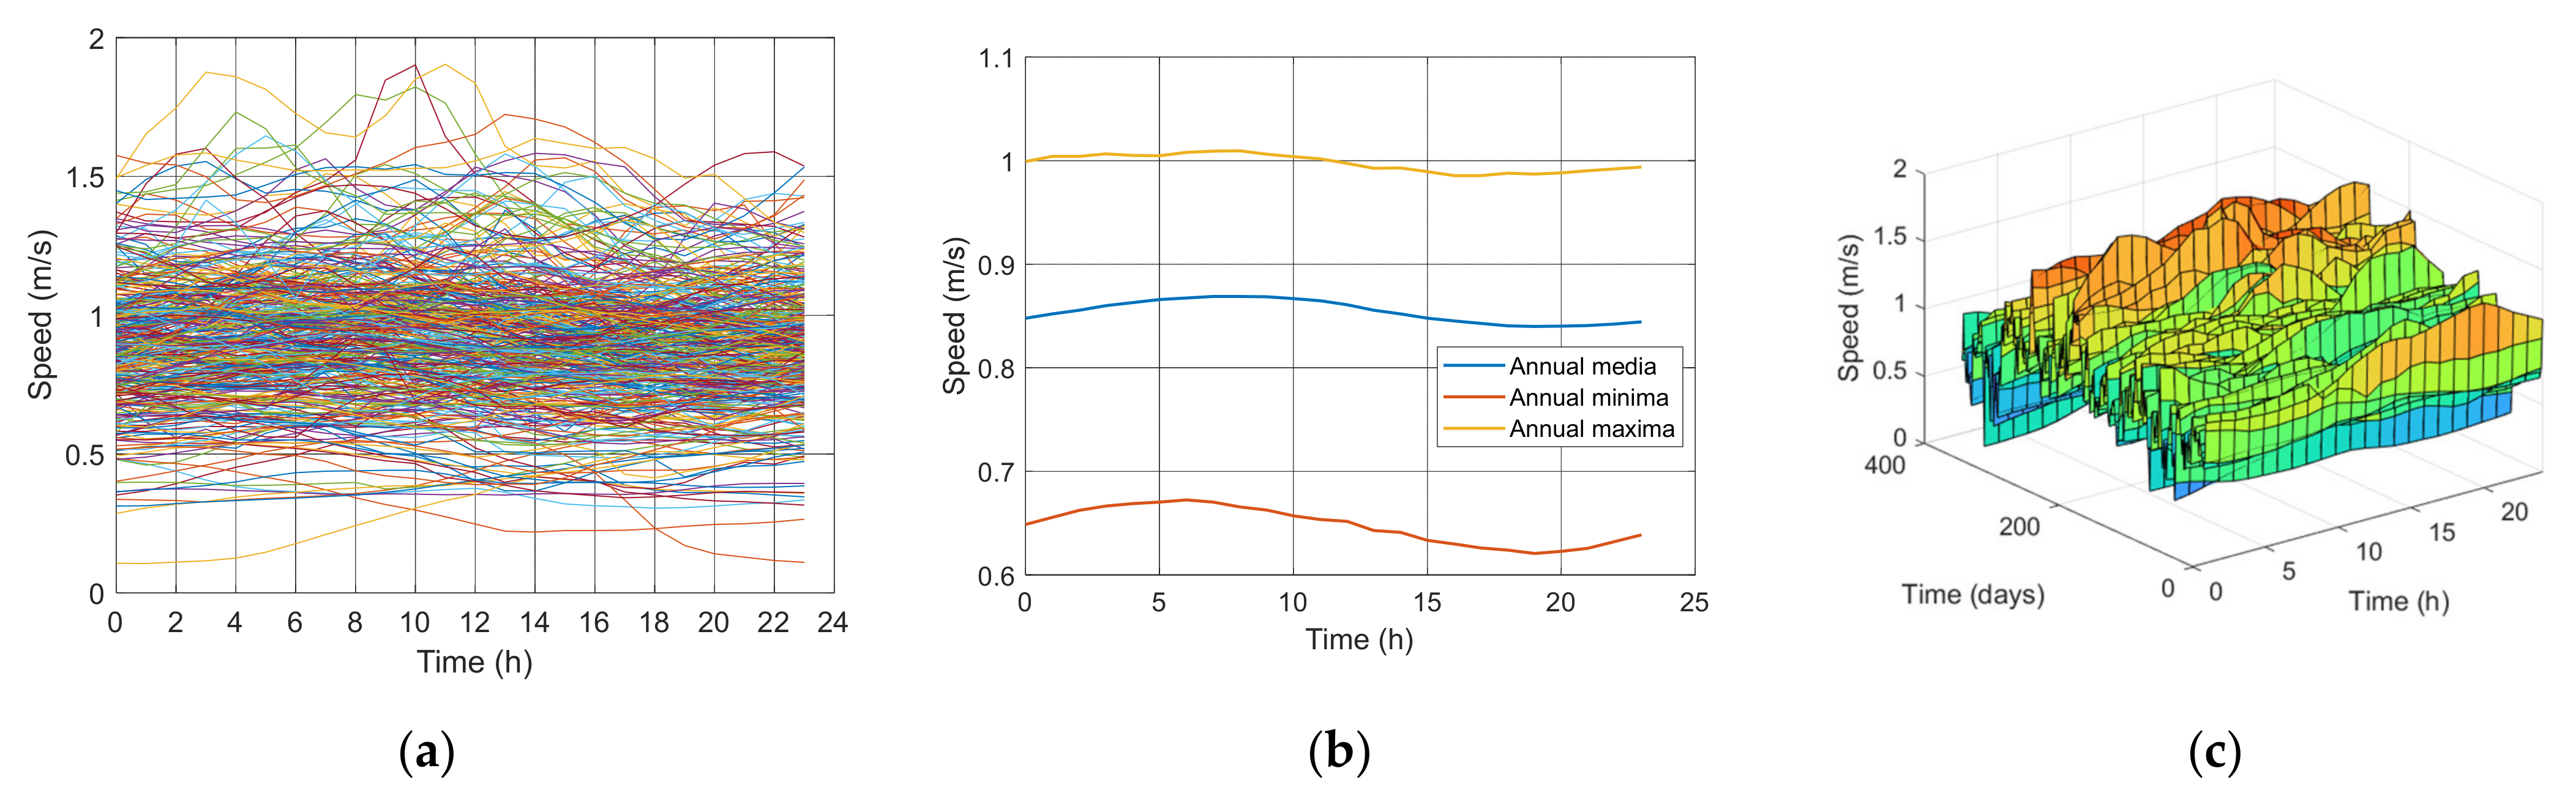
2.1. Solar PV and Marine-Current-Energy Potential in Cozumel

Figure 2 and Figure 3 show the potential profile to size the solar photovoltaic system (PVS) and the marine-current system (MCS), respectively. For this study, 1 h data resolution was considered for both VREs; solar data were obtained from the Photovoltaic Geographical Information System (PVGIS), and the data analysis was based on Yunez-Cano et al. 2016 [25]. A higher daily potential of solar energy can be obtained using solar-tracking systems as power and efficiency can increase mainly in large-scale solar energy applications [26]; in this work, as the information on this is insufficient, their effect is not included. Marine-current-energy data were provided by the CEMIE-Océano project Mexico [27]; for both systems, data from 2014 were considered. The Köppen–Geiger climate classification of the Cozumel is Aw, which presents a tropical savanna climate characterized by an extensive dry season that is more marked and prolonged than in the monsoon climate and which contrasts with a rainy season with intense rainfall [28,29]. The seasonality analysis considered the spring months (March–May), summer months (June–August), fall months (September–November), and winter months (December–February) [30].
Figure 2a and Figure 3a show the daily standard behavior of solar energy and marine-current energy, where the variations in solar irradiance and marine-current speed are evident at different times (daily variability). Solar potential was obtained via the integration of irradiance data (W/m2) during the day to obtain the irradiation potential (kWh/m2) (Figure 2b). The marine-current seasonal potential is defined as the average of daily measurements of marine-current speed (m/s) for each month (Figure 3b).

2.2. Home-Load Profile

The home-load profile with 1 h resolution represents an average energy consumption (EC) of 7.5 kWh/day for a home on the Mexican coast [31,32]. Energy consumption was obtained from the statistical yearbook Quintana Roo state in Mexico in 2017, developed by the National Institute of Statistics and Geography [33]; Figure 4 shows the daily standard-load profile.

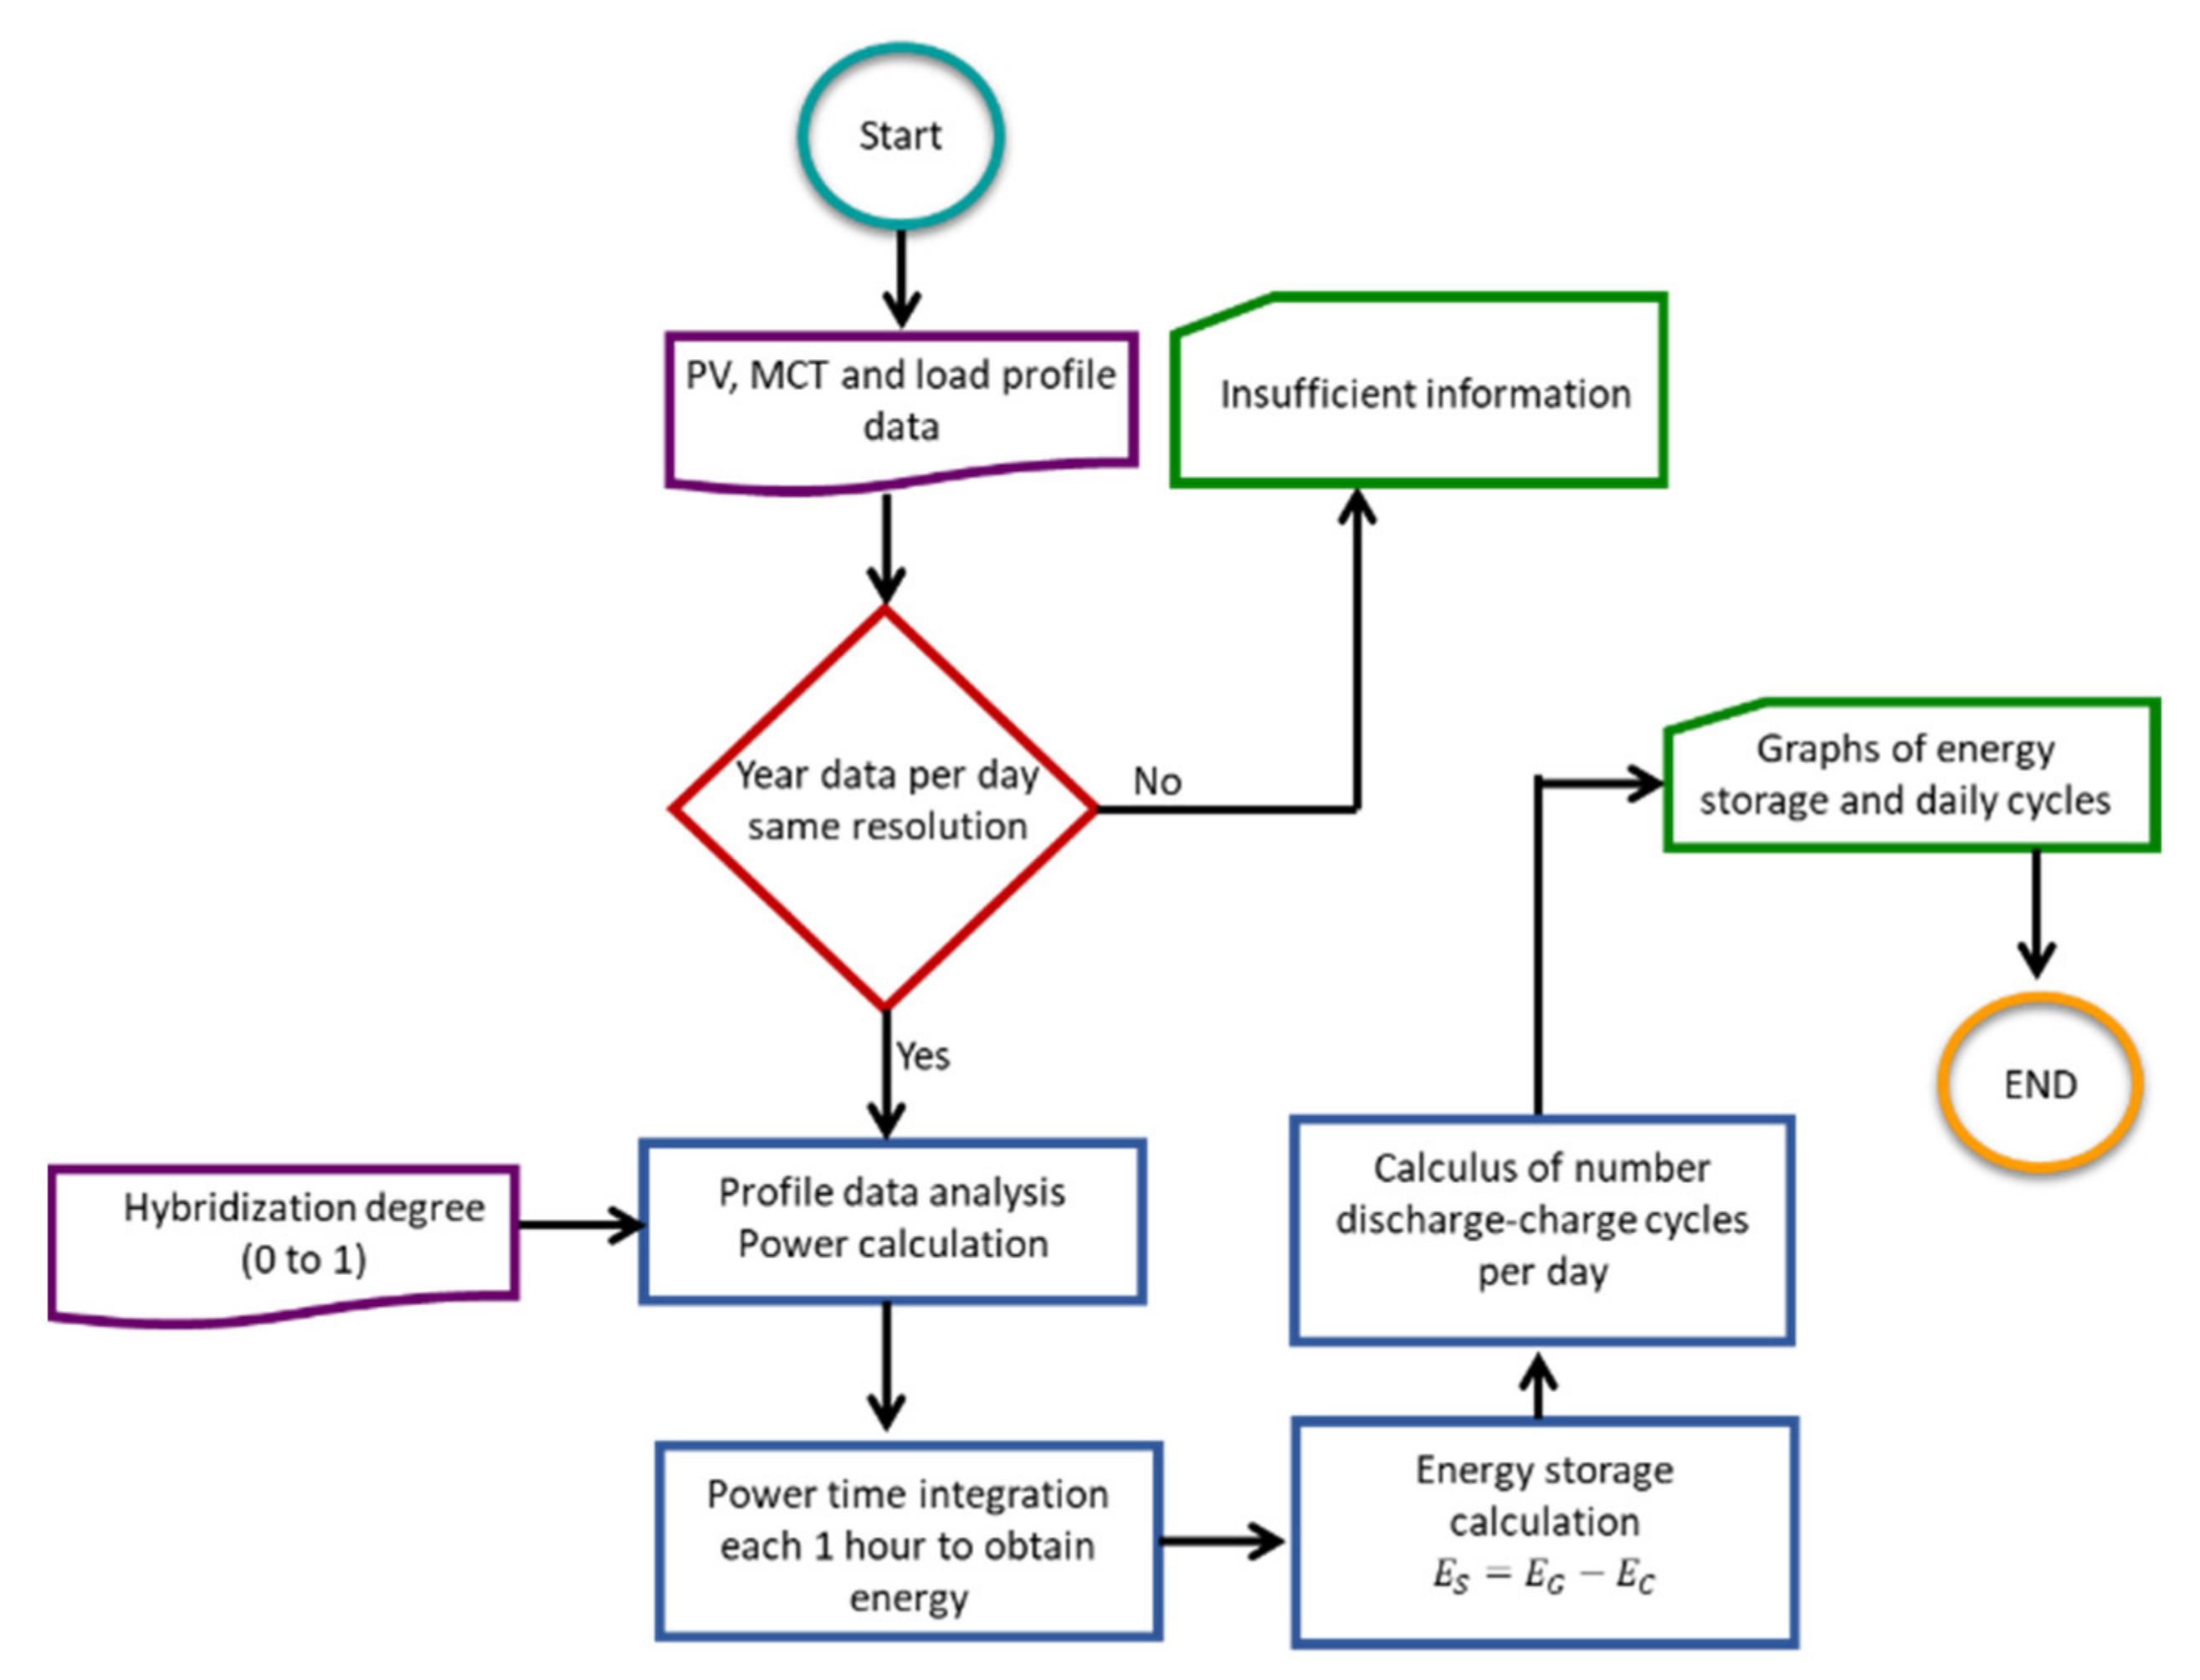
2.3. Sizing and Design of the Renewable Energy Hybrid System

SMHES sizing is based on the analysis of the profiles of solar irradiance (Figure 5) and marine-current speed (Figure 6). The sizing of both renewable energies was carried out based on the assumption that the energy supplies are provided individually and independently of each other. Figure 5a and Figure 6a show the daily solar irradiance and marine-current-speed variations in a one-year timelapse. Figure 5b and Figure 6b show the minima, maxima, and year averages to identify the maximum variations during the year; this shows the occurrence of days with higher or lower power generation than that estimated for sizing. The SMHES was dimensioned with respect to the seasonal potential minima [34]. In the case of the PVS, it was dimensioned with the minimum daily irradiation in December (4.72 kWh/day) (Figure 5c), while the SCM dimensioning was carried out with the minimum speeds in November (0.65 m/s) (Figure 6c).

2.3.1. PV Solar System Sizing

The sizing of the PVS was carried out according to annual irradiation minimums (Equation (1)) [34,35].
P P V S = E P V O u t G C E M G d m η
where PPVS is the minimum power-installed capacity (kW) of the photovoltaic system, which was obtained directly through energy consumption per day (EPVOut, kWh/day); GCEM is the solar standard-test irradiance (1 kW/m2); Gdm is the solar irradiation, which in this case is proposed as the media in the month of lower irradiation, December (4.72 kWh/m2 day); and η is the overall efficiency of the auxiliary equipment (DC–DC controller regulator). Note that solar panel efficiency is not considered in Equation (1); the installed capacity is evaluated through commercial parameters where 300 W is proposed for solar panels (tested at 1 kW/m2).

2.3.2. Marine-Current-Energy System Sizing

The marine-current system (MCS) is mainly composed of the marine-current turbine (MCT) and the permanent magnet synchronous generator (PMSG). The MCT instantaneous power PMCT (kW) can be calculated using Equation (2) [36].
P M C T = 1 2 ρ C p A   V 3
where ρ is the seawater density, V is the current speed in m/s, and A is the cross-area section of the turbine. Cp is the power coefficient (dimensionless), which is a function of the tip speed ratio and pitch angle; for the typical marine-current turbine (MCT), Cp values are considered in the 0.35–0.5 range. A turbine with a diameter of 2 m is proposed, based on that reported by Shirasawa et al., 2016 [37], which allows the turbine to operate at the current speeds of Cozumel (~0.7 m/s).
To obtain the daily energy production, the integration of the power-generation profile was carried out. The daily marine-current energy (EMCS) supplied by the MCS is given by Equation (3), where t is the time and η is the overall efficiency of the equipment (PMSG and AC–DC controller regulator).
E M C S = 0 t P M C T   d t η  

2.4. Solar PV–Marine Current and Energy-Storage System Hybridization

The SMHES hybridization analysis consisted of evaluating the energy supply with different PVS and MCS degrees of utilization for the 365 days of the year. A 0 HD considers that energy is provided only from the PVS and 1 HD when the energy is provided completely from the MCS. Therefore, hybridization supposes a decrease in the installed capacity of the PVS or MCS. In this study, the hybridization analysis was carried out using an algorithm developed in Matlab® software (Figure 7). The analysis procedure consisted of four steps; first, the power of each system was integrated as a function of time intervals of 1 h in a whole year; second, the HD was proposed from zero to one; third, the energy generated and consumed was obtained; and fourth, the energy storage as well as the number of charge and discharge cycles of the storage system were calculated considering the points of intersection between the generation and consumption profiles. In Section 3.1 the results are analyzed.
Daily electricity-power supply (ESMHES) was determined by the HD, which defines the PVS ( E H p v s ) and MCS ( E H M C S ) installed capacity (Equations (4)–(6)).
E H P V S = E P V S   1 H D
E H M C S = E M C S   H D
E S M H E S = E H p v s + E H M C S

2.4.1. Hybrid Energy Storage

A hybrid battery–hydrogen storage system was proposed, and the sizing was carried out based on hybridization analysis, while its relevance was validated through the TOPSIS method. Figure 8 shows the SMHES diagram. The energy balance from Equation (7) determined the daily energy surplus–deficit that was proposed to be covered by the hydrogen energy-storage system (HESS). For hourly fluctuations, a battery energy-storage system (BESS) was proposed, where time fluctuations determined the energy balance; thus, a dynamic model was required. In this analysis, energy balance was carried out at different time intervals (∆t) with 1 h resolution (Equation (8)). The variation between the SMHES generation and the energy consumption (EC) determines the moments in which surplus energy is available to store and when energy deficits are present, and thus, the stored energy must be used.
E H E S S = ( E S M H E S E C )   η H E S S
E B E S S = ( E S M H E S E C )   η B E S S

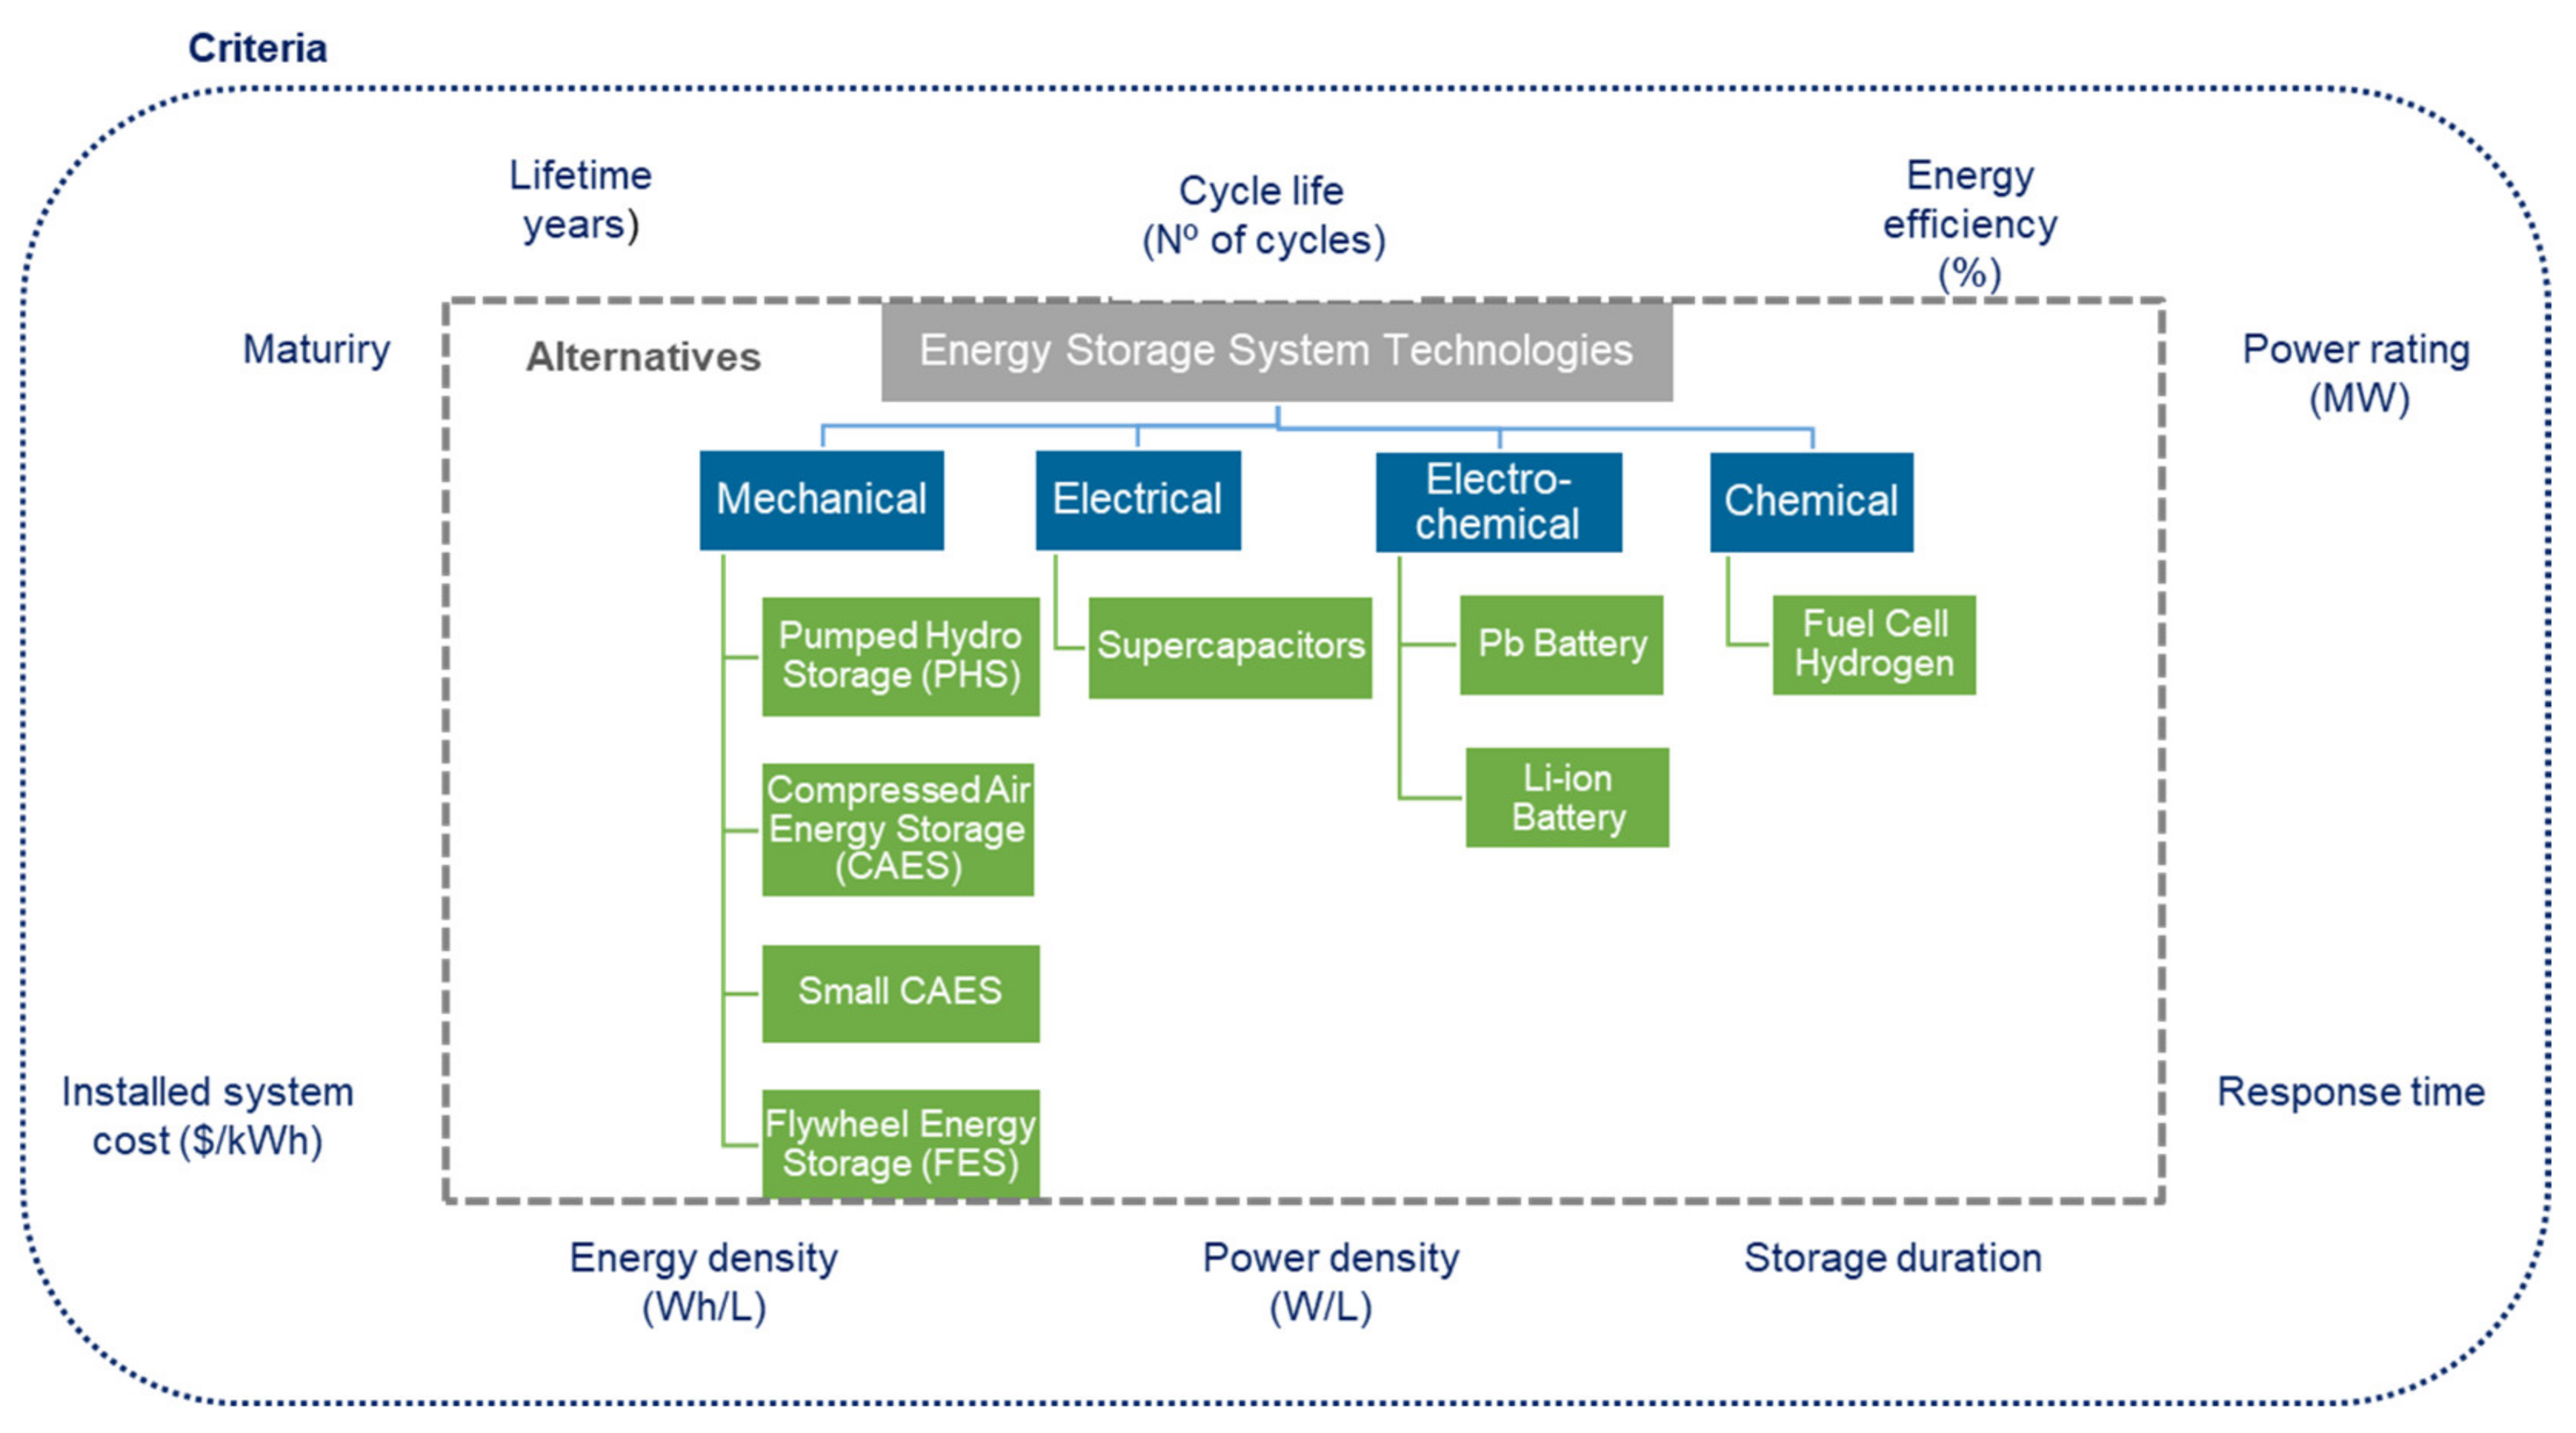
2.4.2. Energy-Storage Selection

Due to the variety of ESS options to evaluate the relevance of the hybrid battery–hydrogen storage system, a MCDA analysis was proposed. In this work, ESSs were evaluated based on three objectives: (a) the Regulation Energy-Storage System (RESS), (b) the Post-Consumption Energy-Storage System (PCESS) for daily, monthly, or seasonal periods; and (c) the Regulation & Post-Consumption Energy-Storage System (RPCESS) for uses where the ESS is considered for the regulation and control of energy supply autonomy on certain days, e.g., batteries [9,38,39]. The proposed MCDA is a combination of the Analytic Hierarchy Process (AHP) and the Technique for Order Performance by Similarity to Ideal Solution (TOPSIS); this method provides solutions to problems involving conflicting and multiple objectives [10]. TOPSIS was developed by Hwang and Yoon (1981) [40] and is based on the concept that the best alternative should have the shortest geometric distance from the ideal positive solution but the largest geometric distance from the ideal negative solution [41,42,43].
The study evaluated eight ESSs with four classifications, (1) mechanical, (2) electrical, (3) electrochemical, and (4) chemical, and ten criteria, lifetime (C1), cycle life (C2), energy efficiency (C3), power rating (C4), response time (C5), storage duration (C6), power density (C7), energy density (C8), installed system cost (C9), and maturity (C10). The TOPSIS method was conducted according to Garduño-Ruiz et al. (2021) [44] and consisted of feeding a decision matrix with a set of alternatives and criteria (Figure 9) and then assigning levels of importance or weightings to each criterion through the AHP technique using the method of Saaty (1990) [45]. To determine the best alternative, the TOPSIS tool was used by means of a Python algorithm.

3. Results

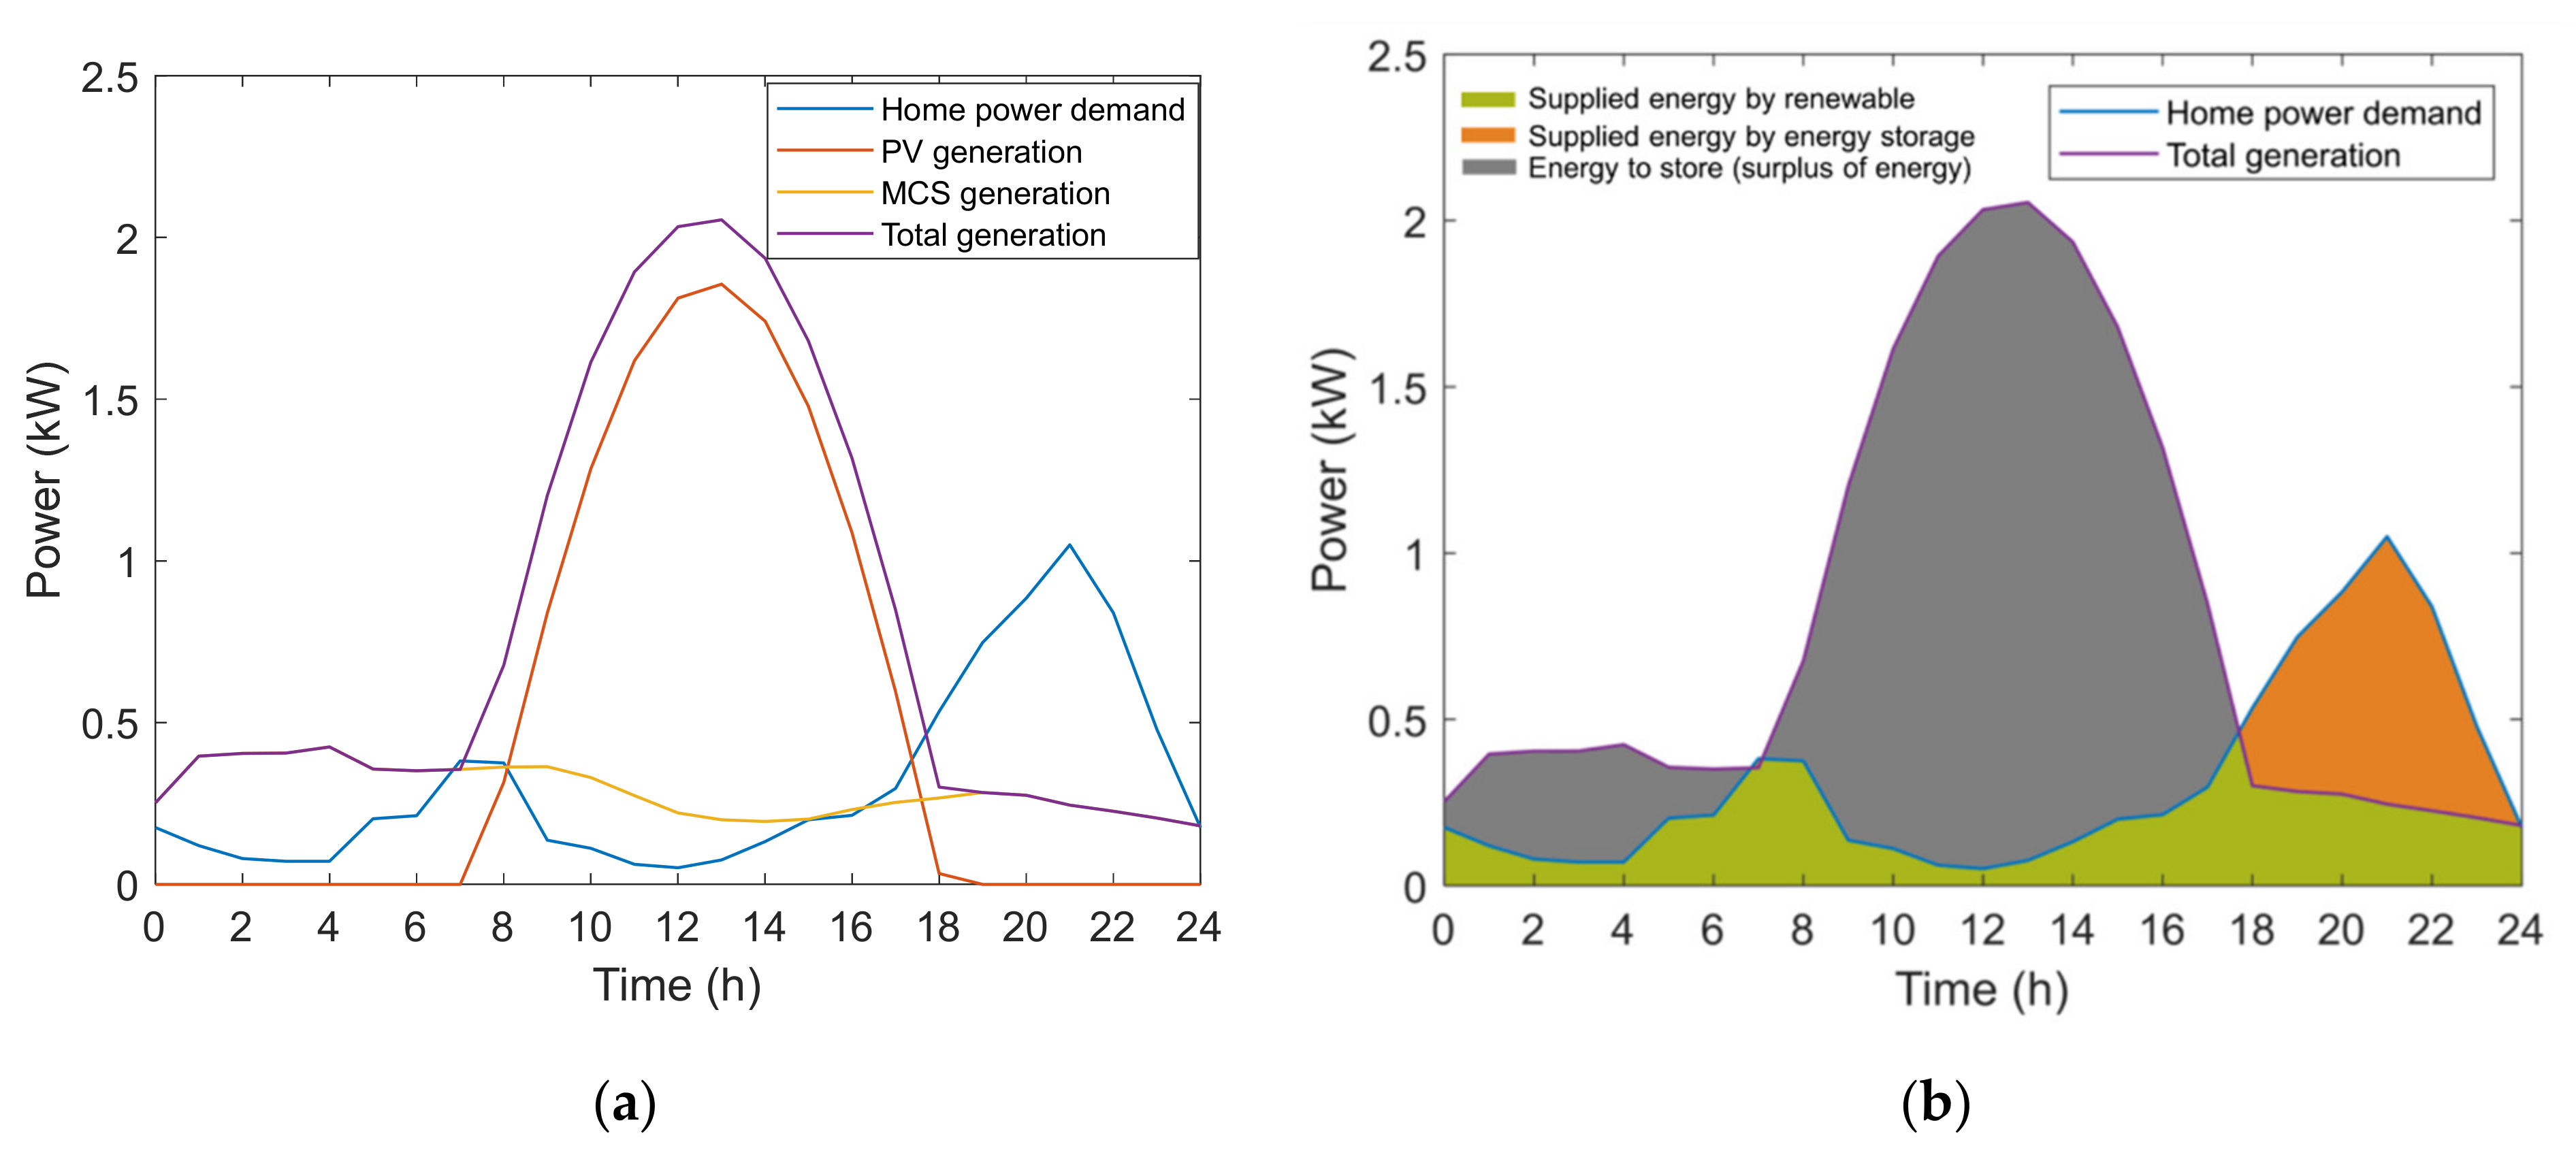
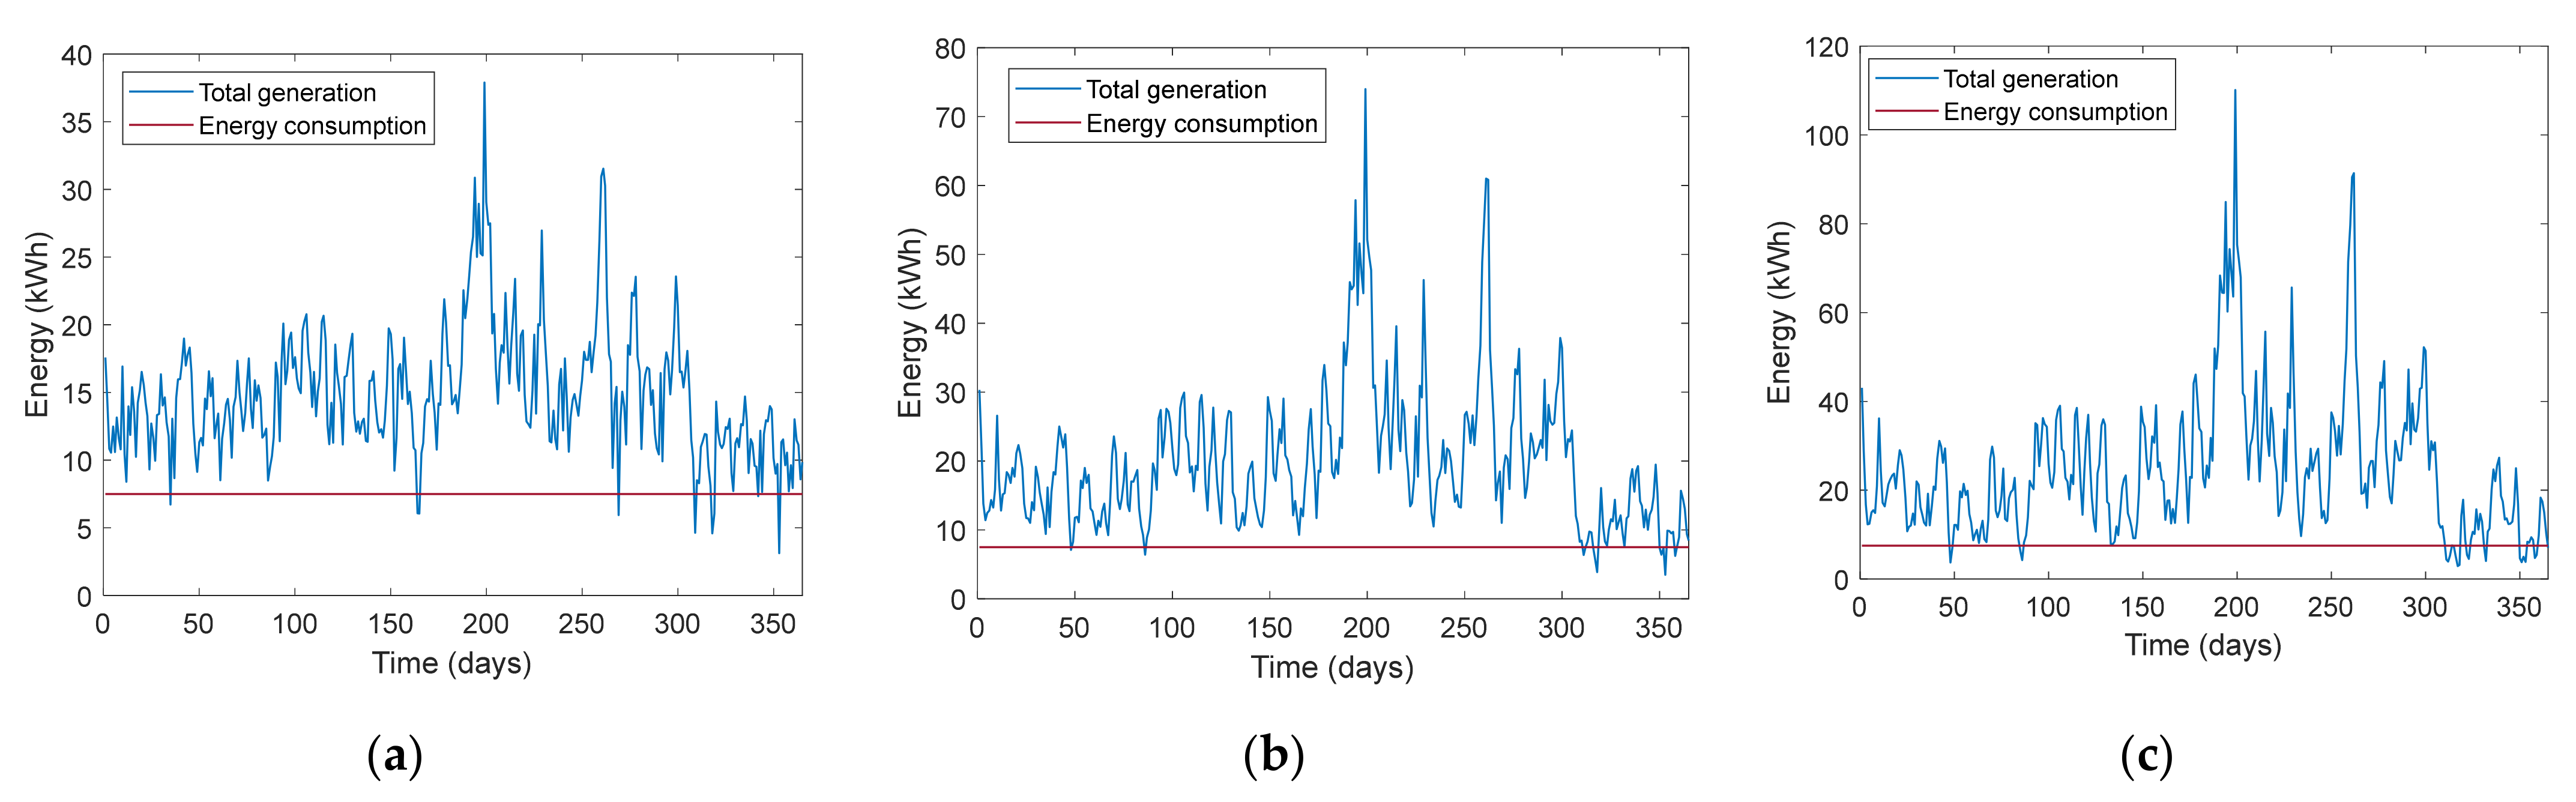
3.1. Renewable-Energy Hybrid System

The SMHES sizing was carried out for 0 HD (only PVS) and 1 HD (only MCS). Table 1 shows the parameters for the PVS and MCS.
The generation profile was analyzed with respect to the home power-demand profile, which allows the hours of the day, when it is possible to cover the energy demand, the range where there is an energy surplus, or where it is necessary to use energy storage to cover the demand to be determined. Figure 10a shows a consumption–generation profile in a representative day in the year (day 355, December) when each renewable system produces 7.5 kWh/day in the seasonal minimums. Under this scenario, the amount of energy extracted from the MCS is higher than that from the PVS due to a higher daily availability; therefore, the MCS requires lower installed capacity, 0.458 kW, while solar requires an installation of 2.1 kW. It is worth mentioning that although the MCS generation profile shows fewer hourly variations, there are fluctuations that are less visible on the scale compared to the PVS generation profile. Figure 10b shows the total generation. The system considers only output power. From this perspective, the intersection of the generation curve with the demand curve allows us to visualize the points where the hybrid system is not able to cover the demand.

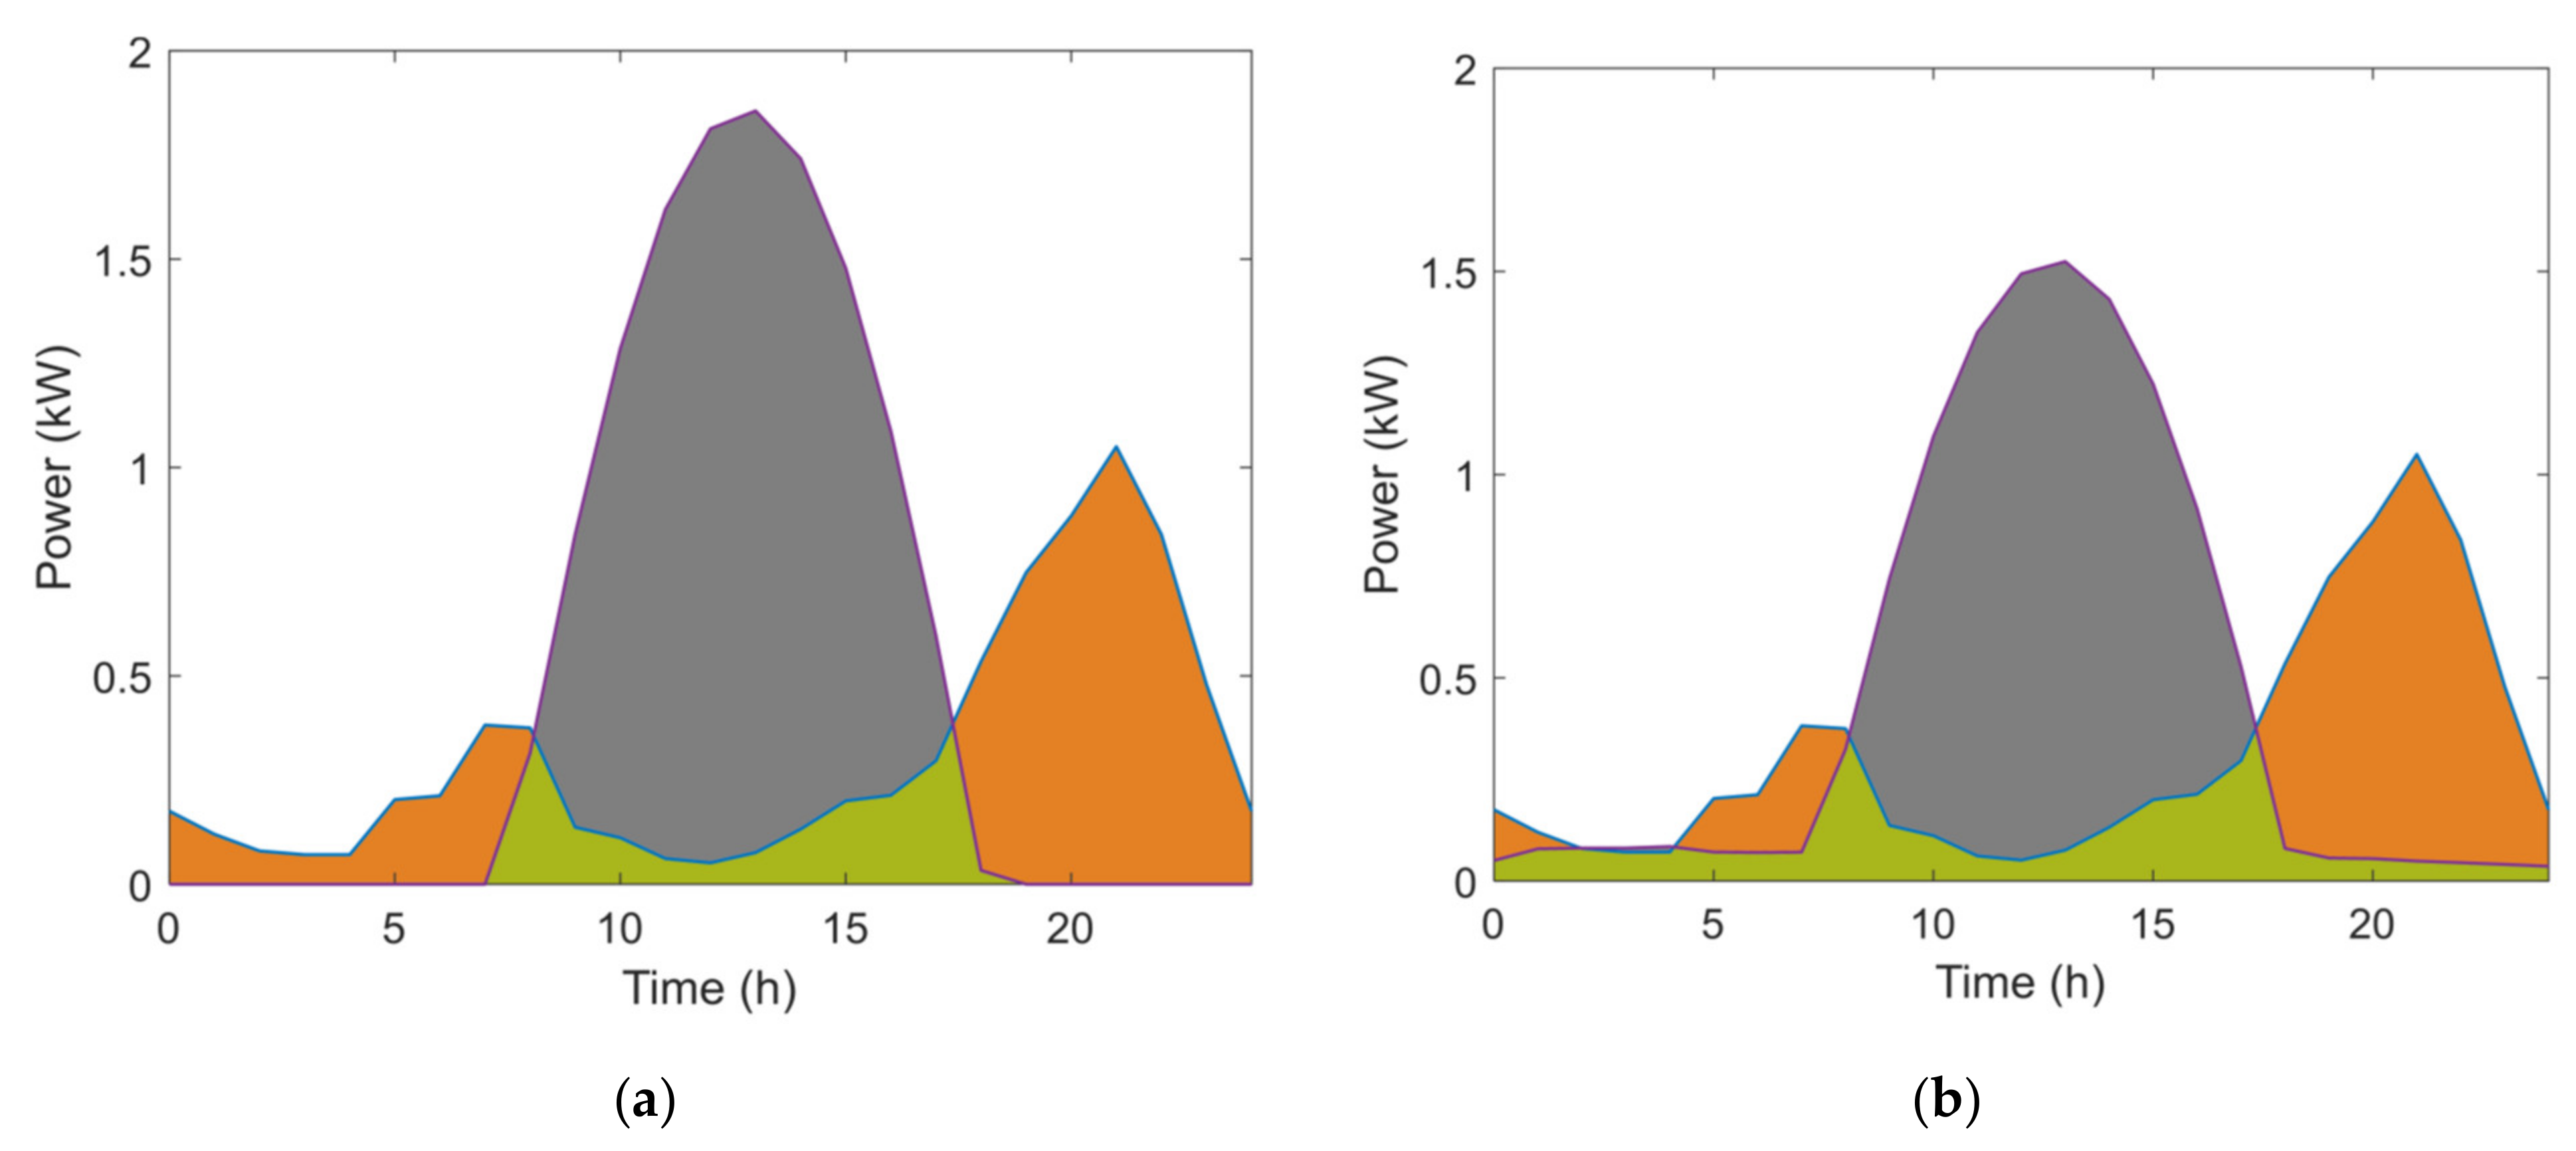
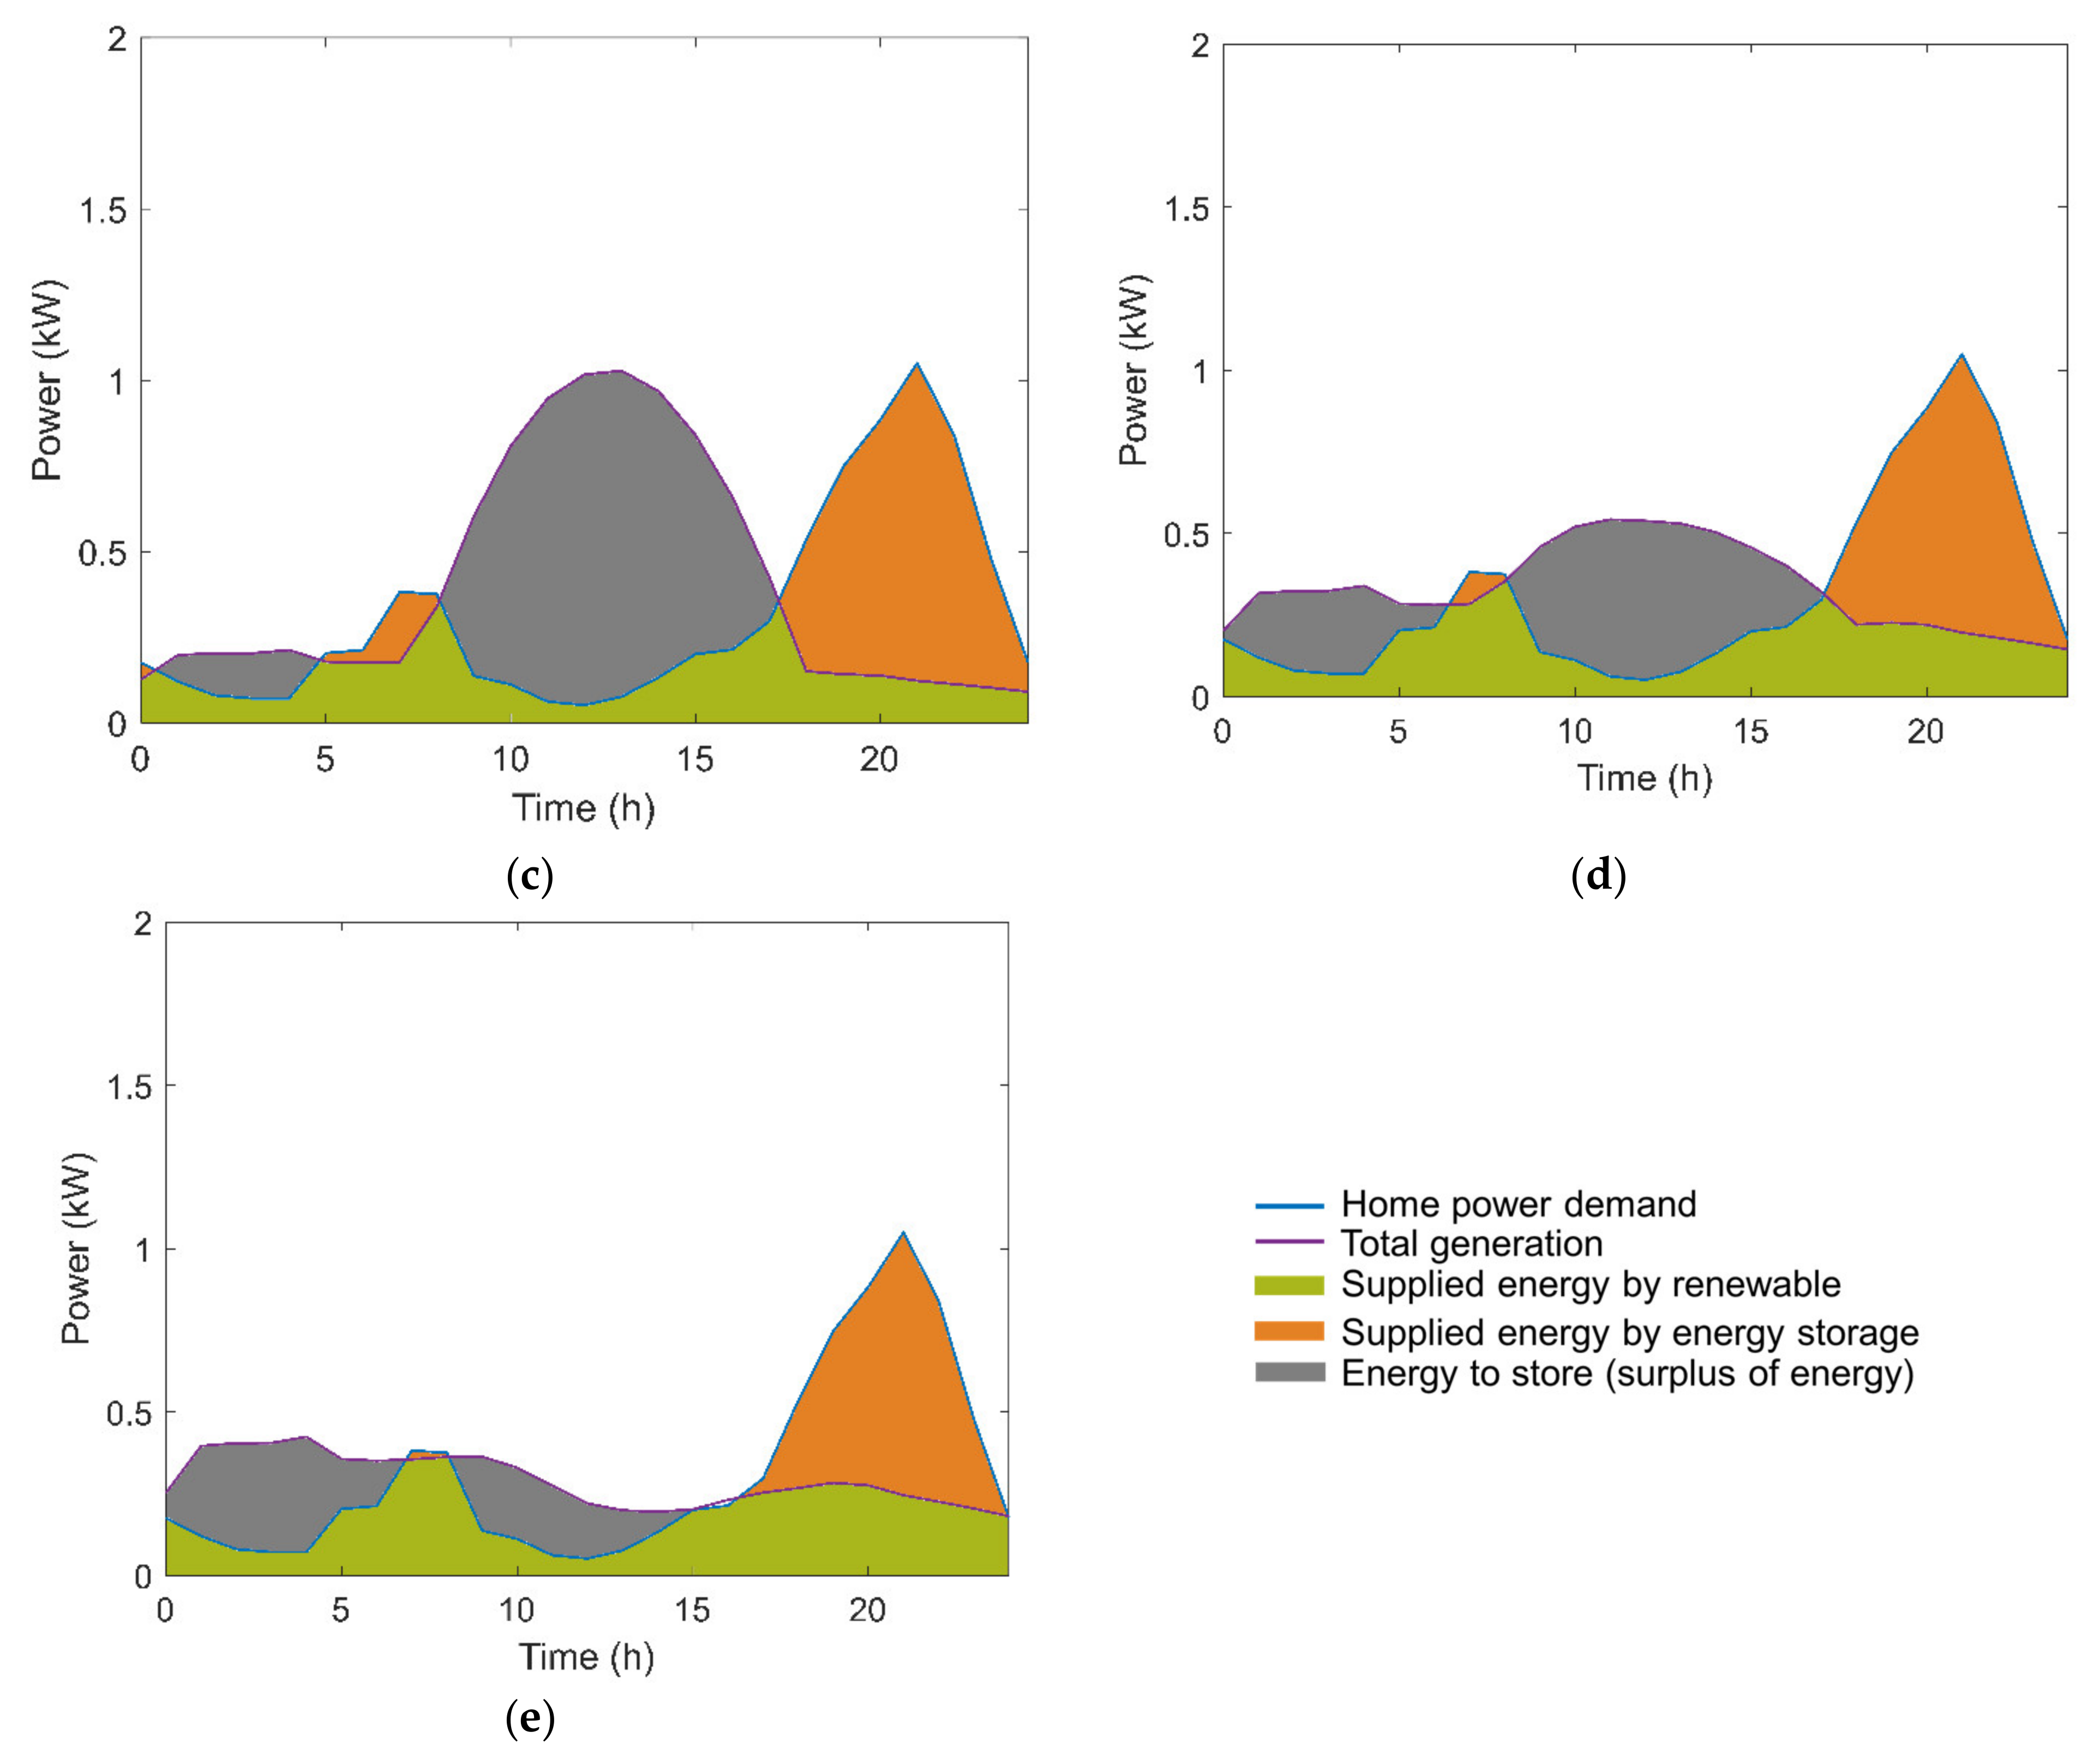
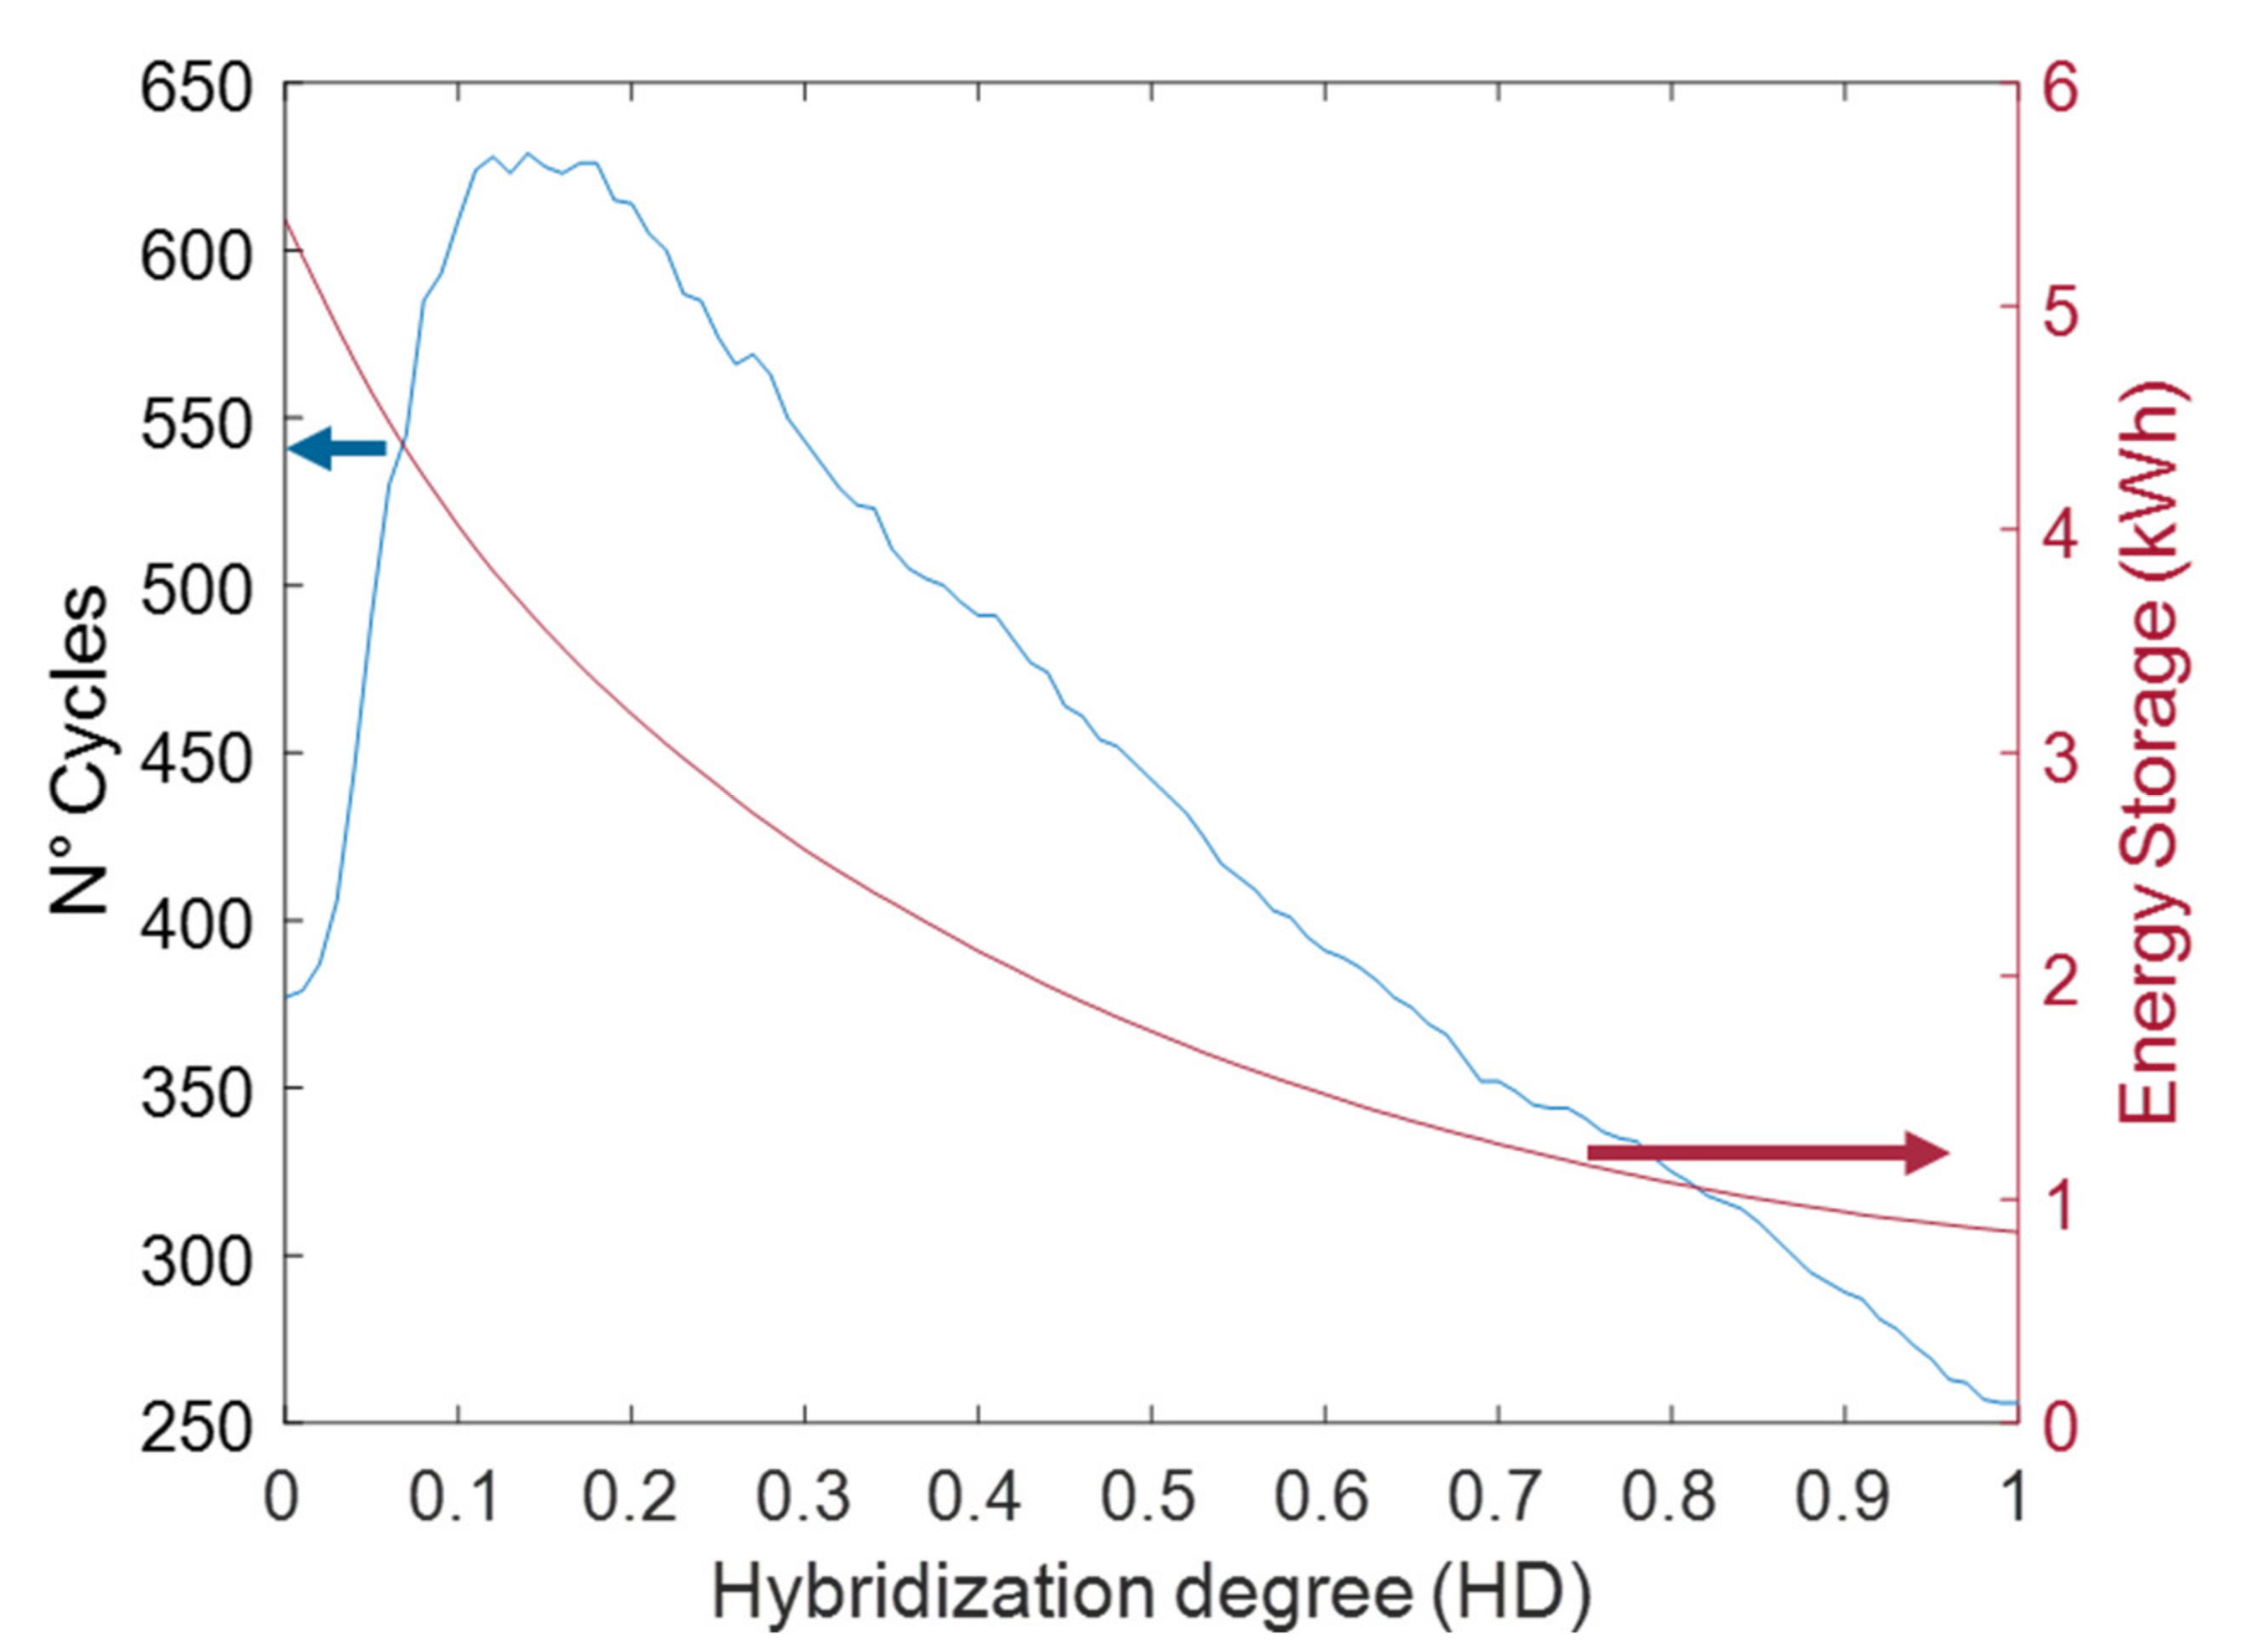
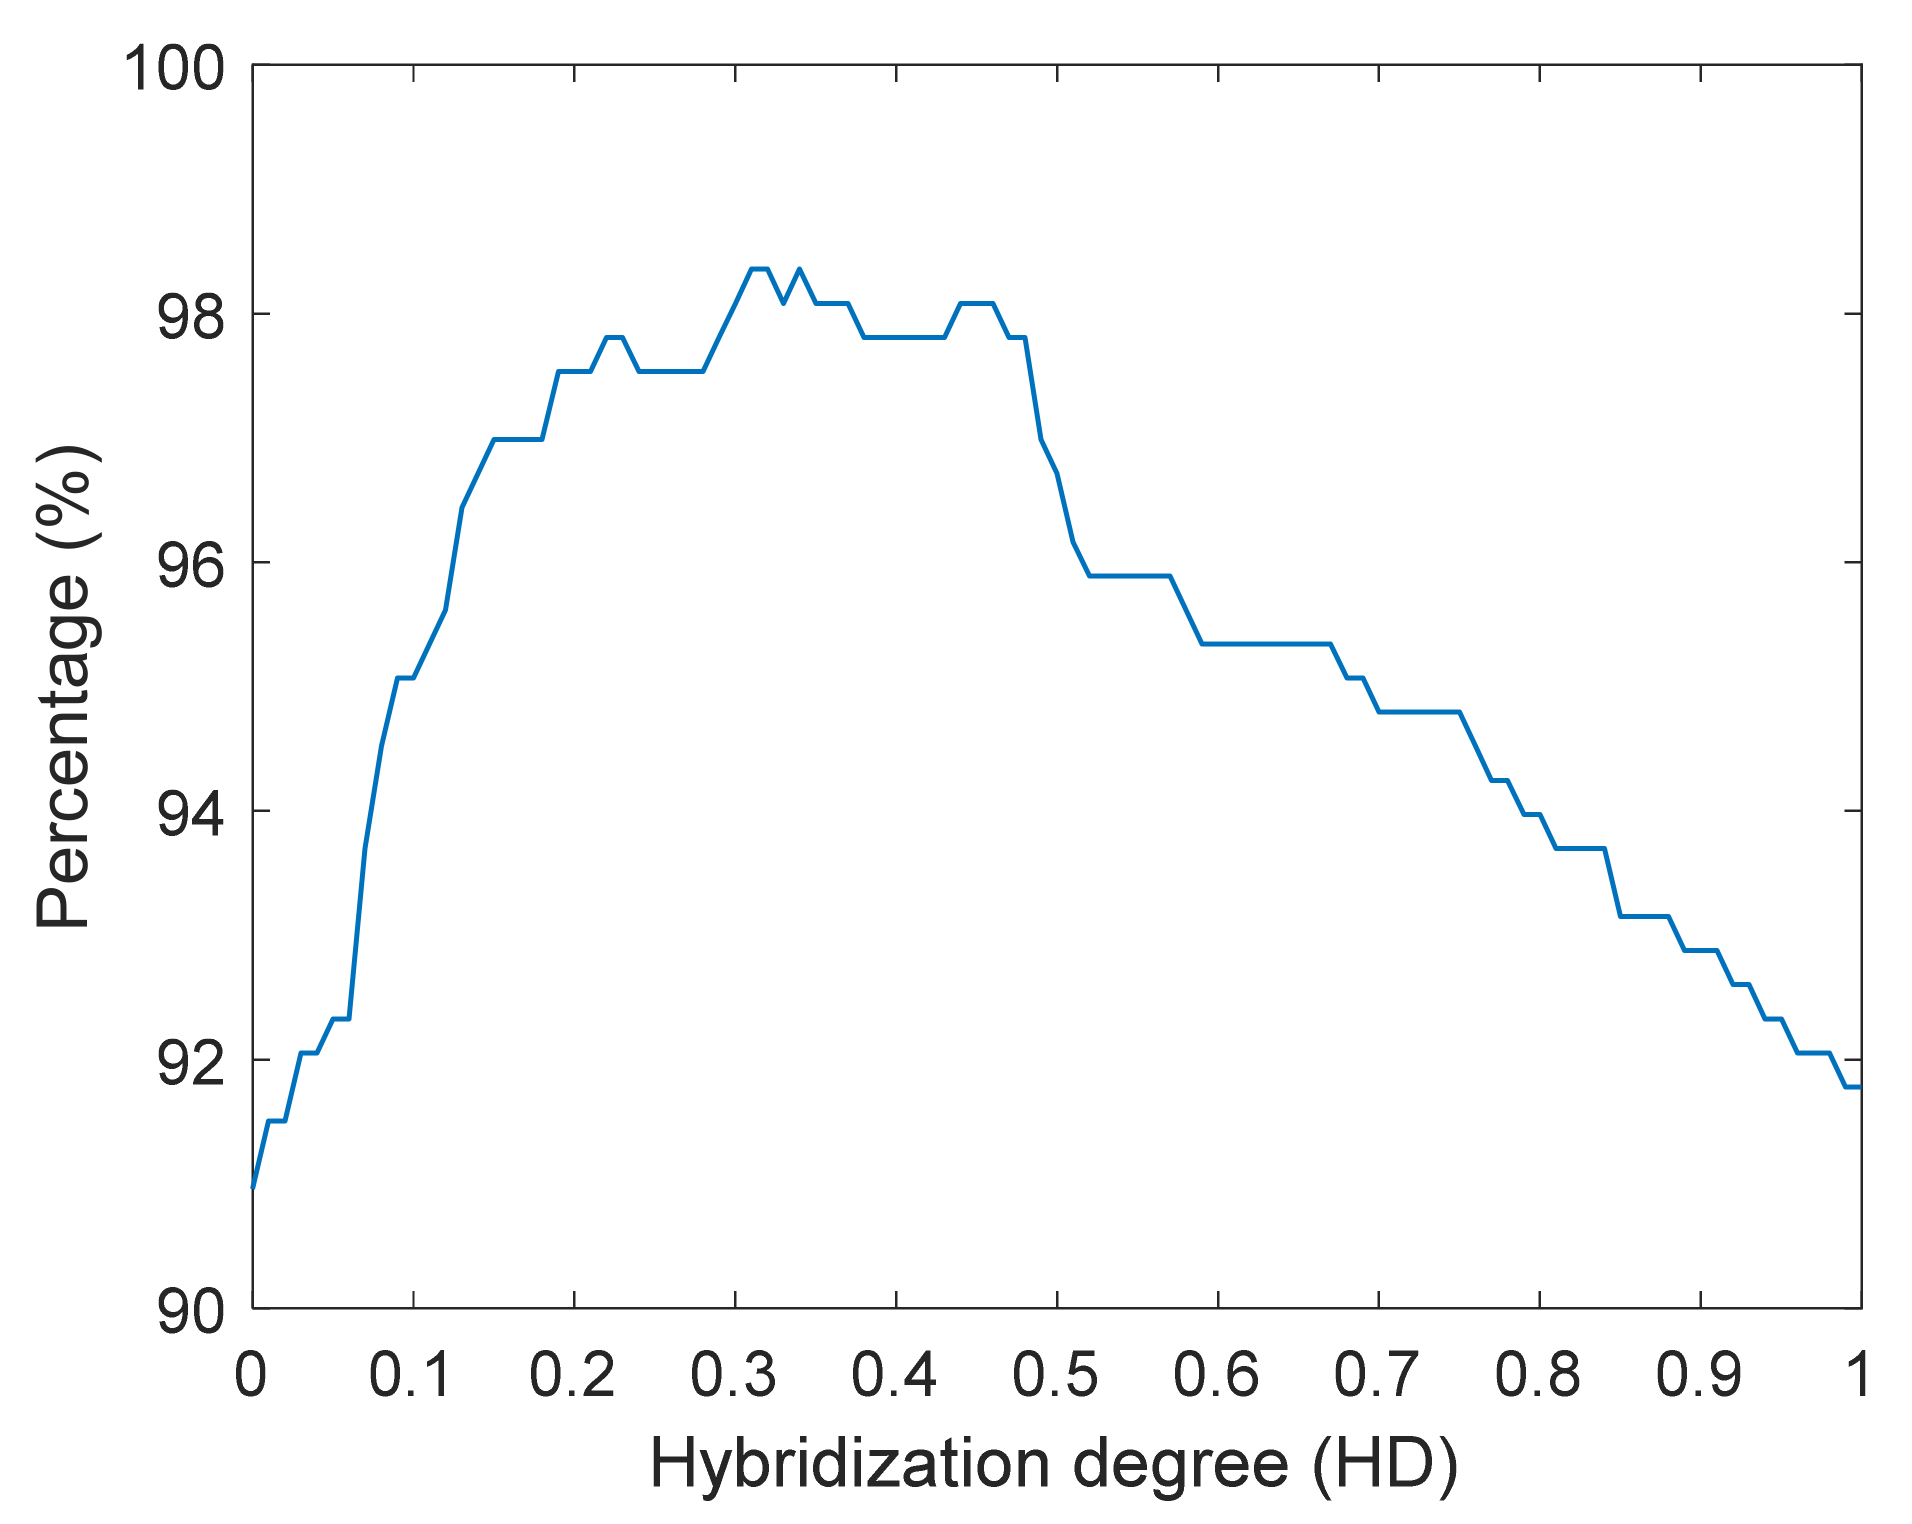
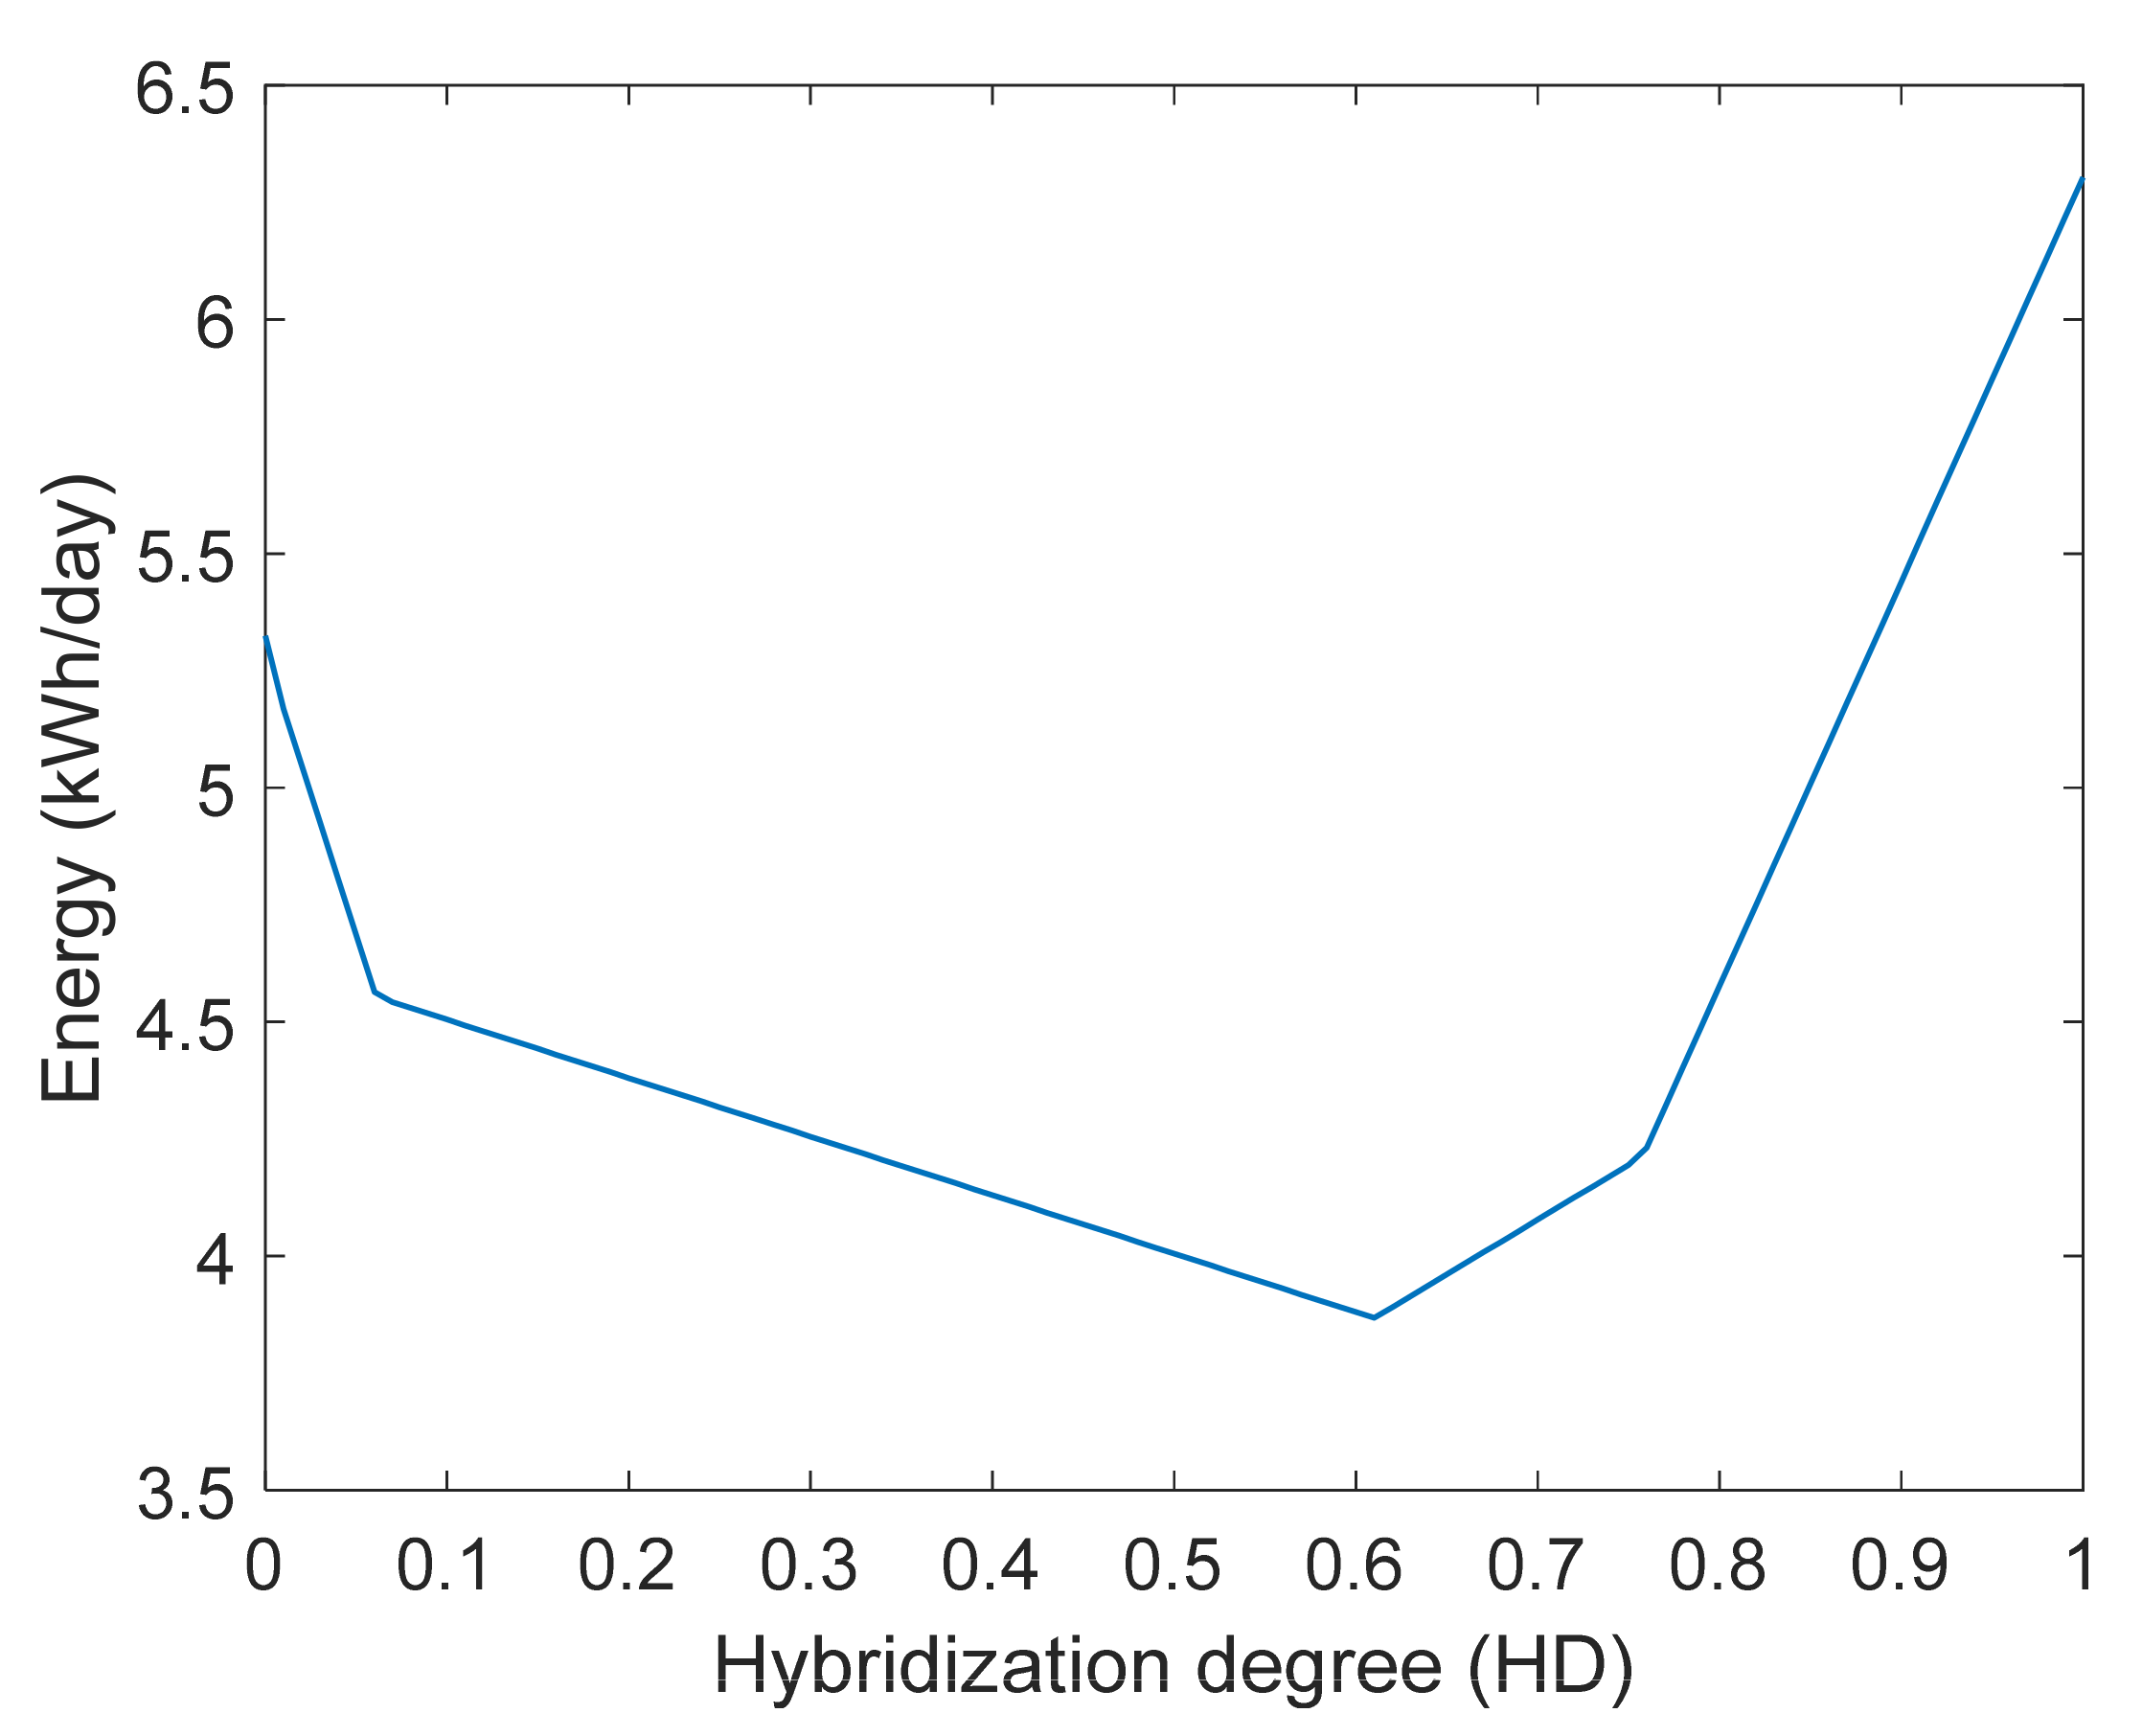
3.2. Hybridization Analysis Results

Applying the algorithm developed in the Matlab® program, the curves of the hybridization process were obtained at different HDs for the 365 days of the year; daily variations during the year are shown in Appendix A in Figure A1 and includes daily variations in energy consumption and supply in the 12 months. Figure 11 shows a representative day (355 day) of generation–consumption profiles with different HDs for comparison. For each case, an energy-balance analysis was carried out for different HDs. Table 2 shows the power (kW) and energy (kWh/day) generation of the SMHES, RPCESS, percentage reduction in the RPCESS for different HDs, and the average charge–discharge cycles.
The graphs in Figure 11 show the total generation of the PVS and the MCS for different HDs. The amount of energy that can be covered by the SMHES can be observed by comparing the area under the curve of the consumption profile of the house to the total generation curve. Similarly, the variation in the maximum power with respect to the degree of hybridization can be observed.
The hybridization mainly affects the total amount of energy stored per day. In Case 1 (HD 0), where the energy is totally supplied by the PVS, the energy required to be stored is 5.39 kWh/day, while for Case 5 (HD 1), where the energy is totally supplied by the MCS, the energy required to be stored is lower than in Case 1 at only 0.85 kWh/day. The number of cycles that the RPESS has to perform to achieve this goal is one cycle for Case 1 and three cycles at 0.5 HD. It is worth mentioning that these cycles do not imply full charge or discharge. The RPESS can have important implications in the cycle life as the number of cycles increase, with triple the charge–discharge cycles than with 0.5 HD. However, the capacity of the RPESS can be reduced by 55% for HD = 0.5 and 79% for HD = 1. This capacity reduction is due to the similarity of the demand and MCS profiles during the daytime to the PVS.

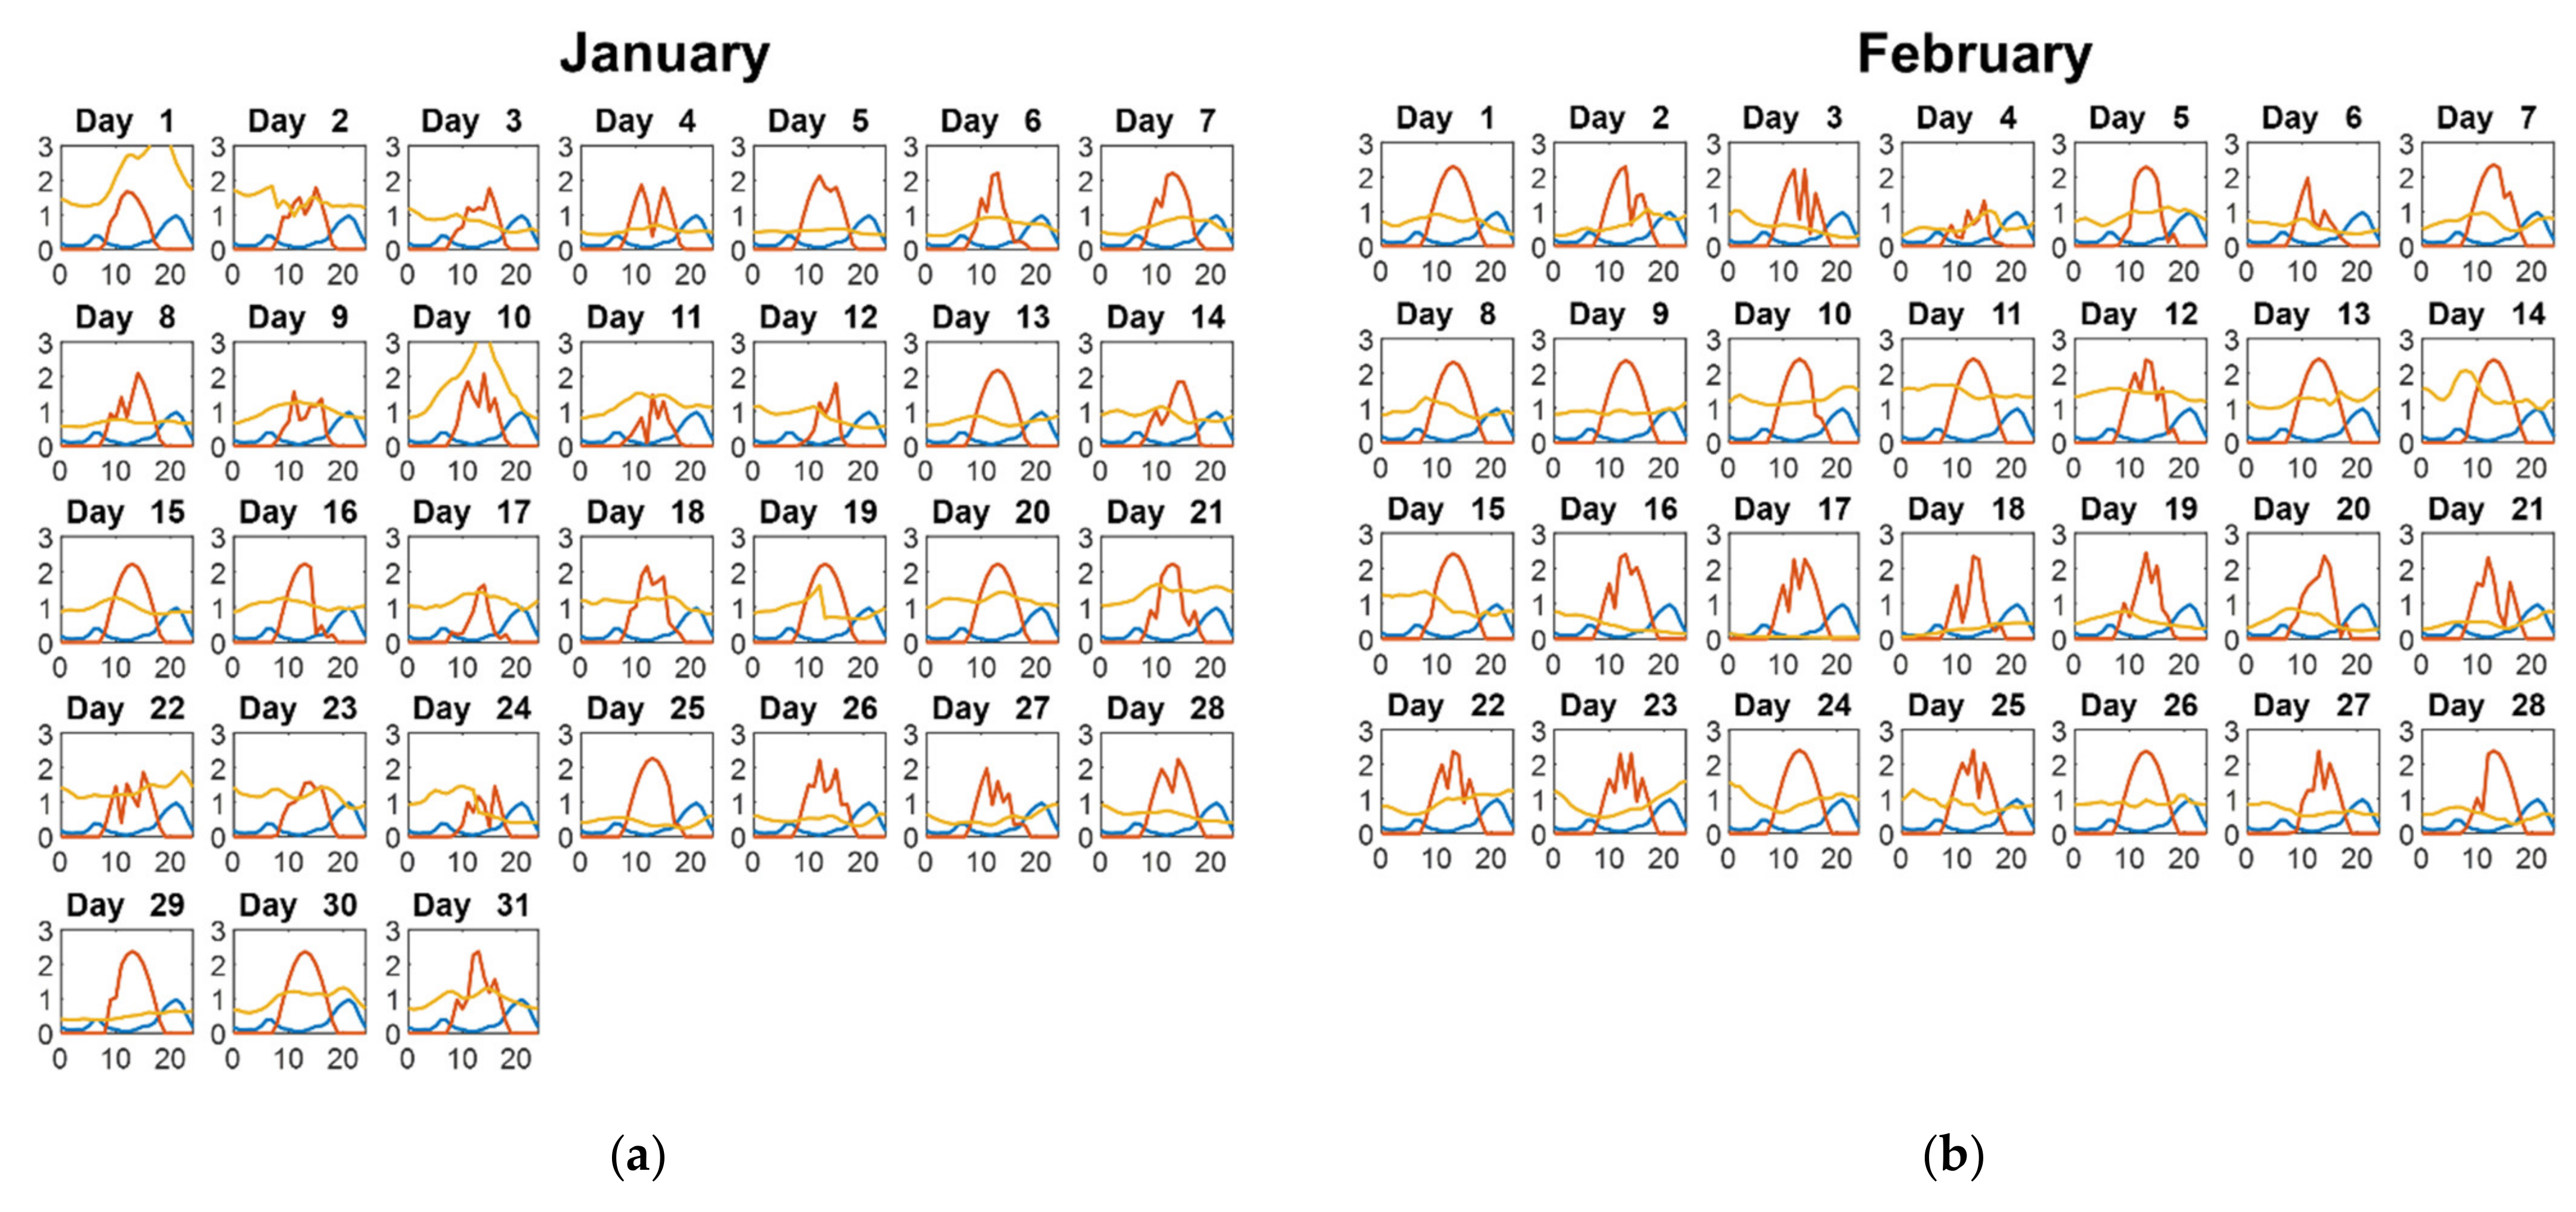
3.3. Evaluation System Hybridization in the Year

The annual analysis allowed us to determine the total number of required charge and discharge cycles according to the HD (Figure 12). The analysis showed that 0 HD requires more daily energy storage, 5.5 kWh/day, than 1 HD requiring 0.85 KWH/day, while the number of cycles per year is higher at 0.2 HD that the other HD.
According to the analysis in Section 3.1, the daily consumption (7.5 kWh/day) can be easily covered by the production of the PVS and MCS at different HDs. The estimated amount of energy lost with the full participation of the PVS (HD 0) is 1477 kWh/year (Figure 13a), while for a system with the full participation of the MCS (HD 1), it is 7576 kWh/year (Figure 13b). This surplus energy can be stored for days with a higher consumption than the estimated value (base load) and for days where the amount of energy produced by the SMCHS cannot cover the energy demand.
These results show that a greater participation of the PVS has advantages in terms of lower seasonal storage (lower seasonal losses). However, seasonal storage also depends on the HD (Figure 14). In the case of 0.2 HD, the energy surplus is 2697 kWh/year; for 0.5 HD, it is 4527 kW/year; and for 0.8 HD, it is 6296 kWh/year.
It was necessary to evaluate the seasonal variability of the system since it would help to complement the results obtained from the daily analysis. From this analysis, the percentage of days of the year in which the demand can be totally covered was found to be 91% for 0 HD and 92% for 1 HD, while the highest availability was found for 0.3 HD at 98.5% (Figure 15).
To cover the deficit of energy, different alternatives can be used, from oversizing the SMCHS to the use of an auxiliary internal combustion system, increasing the PCEES capacity or using a second ESS; for this purpose, a PCESS was used. Figure 15 shows that despite having an adequate coverage of days, most of the ESSs have significant surpluses of energy that are not used, as shown in Figure 13 and Figure 14. Figure 16 shows the amount of seasonal minimum storage required for days, which is unable to cover the base demand. The results indicate that at 0 HD, it is 5.4 kWh/day, while at 1 HD, it is 6.4 kWh/day. The analysis showed that the HD with the lowest seasonal storage for these days is 0.6 HD with 3.86 kWh/day.

3.4. Energy-Storage Selection

Renewable-energy hybridization analysis determines the feasibility of the degree of participation of the PVS and MCS based on the daily number of cycles of the storage system. The determination of the best RPCESS and PCESS options for a specific application is an important task, which requires the analysis of several factors (described in Table 3). Many aspects should be considered for the evaluation of a storage system; the most critical factors in this study were power rating (C4), response time (C5), and storage duration (C6), as the objective was to validate the technology.
According to the methodology of Saaty, the weighting carried out is considered reasonable, given that the consistency ratio (CR) was less than 0.1 (Table 4). On the other hand, the evaluations carried out with the TOPSIS method found that the electrochemical classification of EESs was better than the mechanical classification since the criterion power rating was minimized to find an EES with a low power rating. The best options were as follows: (1) li-ion batteries and (2) Pb batteries for the RPCESS (Table 5); (1) hydrogen and (2) small CAES for the PCEES; (1) supercapacitors and (2) li-ion batteries for the REES based on the best response time.
The obtained results consider the fluctuations between generation and demand in time intervals from hours to months (seasonal). The importance of daily storage was found to be able to cover the energy-demand profile, and variations in seasonal energy expedients were shown. Often, in stand-alone systems, the ESS is oversized in order to cover days with a higher consumption or lack of renewable generation. However, this might compromise the cycle life due to the number of daily cycles that the ESS performs. Therefore, a reserve (backup) storage system that exploits seasonal surpluses may be a technically viable alternative. The storage viability for daily and seasonal storage was evaluated through a multi-criteria method.
For energy storage for the RPCESS (daily fluctuations), it was found that the most important criteria are response time followed by the number of cycles and efficiency. In the case of the PCESS (seasonal fluctuations), the most important criteria are the duration of storage, followed by the response time; as it is used for low-power systems, a low-power range is better. The results of the Multi-Criteria Decision Analysis (TOPSIS) for the selection of the best ESS are shown in Table 5, which are listed from one to eight at the feasibility level. The RESS, PCESS, and RPCESS are compared, and a hierarchy is shown: (1) is the best option, and (8) is the worst storage system option. For the REES, supercapacitors were found to be adequate for periods of time shorter than days, while for longer periods, PCESS hydrogen storage is adequate, and RPCEES lithium-ion batteries are the best alternative. This information allows us to validate the importance of developing lithium-ion batteries and hydrogen energy-storage systems.

4. Conclusions

Sun and marine currents are broadly available renewable resources on coastal zones, and at first sight, choosing one or the other seems unimportant; however, the generation profiles in this work indicate that MCSs have lower daily variability and, consequently, have lower energy-storage requirements. For hybrid photovoltaics–MCSs, this study indicates that for a greater participation of the MCS, the amount of required daily energy storage is lower (79%). On the other hand, the hybridization degree affects the number of daily charge–discharge cycles that the system can stand; for 0 HD in comparison to 1 HD, the cycles increase up to 46%, while for 0.2 HD, the number of cycles increases to 156%. Although this work does not include the characteristics of the ESS, depending on the type of battery or storage system, the number of cycles and the power can influence the durability of the system. However, for energy surpluses, the SMCHS with a higher MCS share can have five times higher losses in comparison to hybrid systems with higher solar shares; these losses can be avoided by using a lower dimensioning factor, although the number of days that cannot meet the demand might increase. The analysis indicates that a HD between 0.3 and 0.5 has a greater effect on the increase in days of minimum generation availability, while seasonal storage at 1 HD increases by 16% compared to using only solar energy (0 HD). Finally, the TOPSIS method for the selection of the best ESS demonstrates the relevance of electrochemical storage (batteries) in stand-alone systems, where the response time between minutes and days is more relevant than for faster technologies; on the other hand, the surplus energy generated due to seasonal variations is ideal for chemical storage in the form of hydrogen. Further studies aiming to improve the limitations of this work, such as analyses of industrial and building consumption profiles, the inclusion of the characteristics and limitations of ESSs, and economic analysis, will be published elsewhere.

Author Contributions

Conceptualization, J.O.-G., R.d.G.G.-H. and G.R.-S.; methodology, J.O.-G., R.d.G.G.-H. and E.P.G.-R.; software, J.O.-G. and E.P.G.-R.; validation, R.d.G.G.-H. and G.R.-S.; formal analysis, J.O.-G., R.d.G.G.-H. and G.R.-S.; investigation, J.O.-G.; data curation, J.O.-G. and R.d.G.G.-H.; writing—original draft preparation, J.O.-G., E.P.G.-R., R.d.G.G.-H. and G.R.-S.; writing—review and editing, J.O.-G., R.d.G.G.-H. and G.R.-S.; visualization, G.R.-S.; supervision, R.d.G.G.-H. and G.R.-S.; project administration, R.d.G.G.-H. and G.R.-S.; funding acquisition, R.d.G.G.-H. All authors have read and agreed to the published version of the manuscript.

Funding

This research was developed under the framework of CEMIE-Océano (Mexican Centre for Innovation in Ocean Energy). Project FSE-2014-06-249795 financed by CONACYT-SENER-Sustentabilidad Energética.

Data Availability Statement

The solar irradiance database used in this paper was from database PVGIS-NSRDB provided by Solar radiation tool from Photovoltaic Geographical Information System, European Commission, (https://re.jrc.ec.europa.eu/pvg_tools/es/#MR, 10 March 2021).

Acknowledgments

The authors would like to thank the Centro Mexicano de Innovación en Energía del Océano (CEMIE-Océano), the Integration to the electricity grid and energy management resources line (I-LT1), the Currents and tidal energy line for the marine current database. IPN multidisciplinary project SIP-2024 (2019-2021) and Ciencia Basica Project A1-S-15770. Jorge Olmedo-Gonzalez acknowledges to CONACYT for the scholarship.

Conflicts of Interest

The authors declare no conflict of interest.

Nomenclature

ACross-area section of the turbinem2
CpPower coefficientDimensionless
ECEnergy consumptionkWh
EHMCSElectricity-power supply from MCTkWh
EHPVSElectricity-power supply from PVSkWh
EMCSDaily marine-current energykWh
EPVOutEnergy consumption per daykWh/day
ESMHESDaily electricity-power supplykWh
GCEMSolar standard-test irradiance1 kW/m2
GdmSolar irradiationkWh/m2 day
PMCTMCT instantaneous powerkW
PPVSMinimum power-installed capacitykW
tTimeh days/months/years
VCurrent speedm/s
ηOverall efficiency of auxiliary equipmentDimensionless
ηBESSBESS efficiencyDimensionless
ηHESSHESS efficiencyDimensionless
ρSeawater densitykg/L

Abbreviations

AHPAnalytic Hierarchy Process
BESSBattery Energy-Storage System
CAESCompressed-Air Energy Storage
ESSEnergy-Storage Systems
HDHybridization degree
HESSHydrogen Energy-Storage System
MCDAMulti-Criteria Decision Analysis
MCSMarine-current system
MCTMarine-current turbine
MREMarine Renewable Energy
PCESSPost-Consumption Energy-Storage System
PHSPumped Hydro Storage
PMSGPermanent magnet synchronous generator
PVGISPhotovoltaic Geographical Information System
PVSPhotovoltaic System
RESSRegulation Energy-Storage System
RPCESSRegulation & Post-Consumption Energy-Storage System
SMHESSolar–Marine Hybrid Energy System
VREVariable Renewable Energies

Appendix A

The appendix includes daily variations in the energy consumption and supply in the twelve months.
Figure A1. Variations in the SMHES for the different months of the year. The variations of solar power generation (orange curve) and marine current power generation (yellow curve) are shown for each day of the year and compared with the daily demand profile (blue curve), (a) January; (b) February HD; (c) March; (d) April; (e) May; (f) June; (g) July; (h) August; (i) September; (j) October; (k) November; (l) December.
Energies 15 00468 g0a1aEnergies 15 00468 g0a1bEnergies 15 00468 g0a1c

References

  1. Uihlein, A.; Magagna, D. Wave and tidal current energy—A review of the current state of research beyond technology. Renew. Sustain. Energy Rev. 2016, 58, 1070–1081. [Google Scholar] [CrossRef]
  2. IRENA. Renewable Energy Prospects: Mexico, REmap 2030 Analysis; IRENA: Abu Dhabi, Saudi Arabia, 2015; Available online: http://www.irena.org/remap (accessed on 24 October 2021).
  3. Rourke, F.O.; Boyle, F.; Reynolds, A. Marine current energy devices: Current status and possible future applications in Ireland. Renew. Sustain. Energy Rev. 2010, 14, 1026–1036. [Google Scholar] [CrossRef] [Green Version]
  4. Hernández-Fontes, J.V.; Felix, A.; Mendoza, E.; Cueto, Y.R.; Silva, R. On the marine energy resources of Mexico. J. Mar. Sci. Eng. 2019, 7, 191. [Google Scholar] [CrossRef] [Green Version]
  5. Cebulla, F.; Naegler, T.; Pohl, M. Electrical energy storage in highly renewable European energy systems: Capacity requirements, spatial distribution, and storage dispatch. J. Energy Storage 2017, 14, 211–223. [Google Scholar] [CrossRef] [Green Version]
  6. Guney, M.S.; Tepe, Y. Classification and assessment of energy storage systems. Renew. Sustain. Energy Rev. 2017, 75, 1187–1197. [Google Scholar] [CrossRef]
  7. Luo, X.; Wang, J.; Dooner, M.; Clarke, J. Overview of current development in electrical energy storage technologies and the application potential in power system operation. Appl. Energy 2015, 137, 511–536. [Google Scholar] [CrossRef] [Green Version]
  8. Sinclair, K.; Copping, A.E.; May, R.; Bennet, F.; Warnas, M.; Perron, M.; Elmqvist, Å.; DeGeorge, E. Resolving environmental effects of wind energy. WIREs Energy Environ. 2018, 7, e291. [Google Scholar] [CrossRef]
  9. Chen, H.; Cong, T.N.; Yang, W.; Tan, C.; Li, Y.; Ding, Y. Progress in electrical energy storage system: A critical review. Prog. Nat. Sci. 2009, 19, 291–312. [Google Scholar] [CrossRef]
  10. Kim, J.; Suharto, Y.; Daim, T.U. Evaluation of Electrical Energy Storage (EES) technologies for renewable energy: A case from the US Pacific Northwest. J. Energy Storage 2017, 11, 25–54. [Google Scholar] [CrossRef]
  11. Bajpai, P.; Dash, V. Hybrid renewable energy systems for power generation in stand-alone applications: A review. Renew. Sustain. Energy Rev. 2012, 16, 2926–2939. [Google Scholar] [CrossRef]
  12. Barelli, L.; Bidini, G.; Bonucci, F.; Castellini, L.; Fratini, A.; Gallorini, F.; Zuccari, A. Flywheel hybridization to improve battery life in energy storage systems coupled to RES plants. Energy 2019, 173, 937–950. [Google Scholar] [CrossRef]
  13. Shoaib, M.; Siddiqui, I.; Rehman, S.; Khan, S.; Alhems, L.M. Assessment of wind energy potential using wind energy conversion system. J. Clean. Prod. 2019, 216, 346–360. [Google Scholar] [CrossRef]
  14. SENER Datos Abiertos de México-Regiones sin Electricidad. Available online: https://datos.gob.mx/busca/dataset/regiones-sin-electricidad (accessed on 22 June 2020).
  15. Sánchez-Dirzo, R.; González-Huerta, R.G.; Mendoza, E.; Silva, R.; Sandoval Pineda, J.M. From wave to jet and from jet to hydrogen: A promising hybrid system. Int. J. Hydrogen Energy 2014, 39, 16628–16636. [Google Scholar] [CrossRef]
  16. Ahmad, S.; Uddin, M.J.; Nisu, I.H.; Ahsan, M.M.; Rahman, I.; Samrat, N.H. Modeling of grid connected battery storage wave energy and PV hybrid renewable power generation. In Proceedings of the 2017 International Conference on Electrical, Computer and Communication Engineering (ECCE), Cox’s Bazar, Bangladesh, 16–18 February 2017; pp. 375–380. [Google Scholar]
  17. Wang, L.; Lee, D.J.; Lee, W.J.; Chen, Z. Analysis of a novel autonomous marine hybrid power generation/energy storage system with a high-voltage direct current link. J. Power Sources 2008, 185, 1284–1292. [Google Scholar] [CrossRef]
  18. Murray, D.B.; Gallagher, P.; Duffy, B.; McCormack, V. Energy storage solutions for offshore wave and tidal energy prototypes. In Proceedings of the 2017 Twelfth International Conference on Ecological Vehicles and Renewable Energies (EVER), Monte Carlo, Monaco, 11–13 April 2017; pp. 1–8. [Google Scholar]
  19. Zhou, Z.; Benbouzid, M.; Charpentier, J.F.; Scuiller, F.; Tang, T. Energy storage technologies for smoothing power fluctuations in marine current turbines. IEEE Int. Symp. Ind. Electron. 2012, 1425–1430. [Google Scholar] [CrossRef] [Green Version]
  20. Askarzadeh, A. Electrical power generation by an optimised autonomous PV/wind/tidal/battery system. IET Renew. Power Gener. 2017, 11, 152–164. [Google Scholar] [CrossRef]
  21. Shirai, Y.; Minamoto, S.; Yonemura, K.; Rahman, M.L. Output power control of hybrid off-shore-wind and tidal turbine generation system with battery storage system. In Proceedings of the 2016 19th International Conference on Electrical Machines and Systems (ICEMS), Chiba, Japan, 13–16 November 2016; pp. 1–6. [Google Scholar]
  22. Wang, L.; Yu, J.-Y.; Chen, Y.-T. Dynamic stability improvement of an integrated offshore wind and marine-current farm using a flywheel energy-storage system. IET Renew. Power Gener. 2011, 5, 387. [Google Scholar] [CrossRef]
  23. Banerjee, S.; Musa, M.N.; Jaafar, A.B. Economic assessment and prospect of hydrogen generated by OTEC as future fuel. Int. J. Hydrogen Energy 2017, 42, 26–37. [Google Scholar] [CrossRef]
  24. Tufa, R.A.; Pawlowski, S.; Veerman, J.; Bouzek, K.; Fontananova, E.; di Profio, G.; Velizarov, S.; Goulão Crespo, J.; Nijmeijer, K.; Curcio, E. Progress and prospects in reverse electrodialysis for salinity gradient energy conversion and storage. Appl. Energy 2018, 225, 290–331. [Google Scholar] [CrossRef]
  25. Yunez-Cano, A.; González-Huerta, R.d.G.; Tufiño-Velázquez, M.; Barbosa, R.; Escobar, B. Solar-hydrogen hybrid system integrated to a sustainable house in Mexico. Int. J. Hydrogen Energy 2016, 41, 19539–19545. [Google Scholar] [CrossRef]
  26. Hafez, A.Z.; Yousef, A.M.; Harag, N.M. Solar tracking systems: Technologies and trackers drive types—A review. Renew. Sustain. Energy Rev. 2018, 91, 754–782. [Google Scholar] [CrossRef]
  27. Alcérreca-Huerta, J.C.; Encarnacion, J.I.; Ordoñez-Sánchez, S.; Callejas-Jiménez, M.; Barroso, G.G.D.; Allmark, M.; Mariño-Tapia, I.; Casarín, R.S.; O’Doherty, T.; Johnstone, C.; et al. Energy yield assessment from ocean currents in the insular shelf of Cozumel Island. J. Mar. Sci. Eng. 2019, 7, 147. [Google Scholar] [CrossRef] [Green Version]
  28. Mazzeo, D.; Matera, N.; De Luca, P.; Baglivo, C.; Maria Congedo, P.; Oliveti, G. Worldwide geographical mapping and optimization of stand-alone and grid-connected hybrid renewable system techno-economic performance across Köppen-Geiger climates. Appl. Energy 2020, 276, 115507. [Google Scholar] [CrossRef]
  29. Cui, D.; Liang, S.; Wang, D. Observed and projected changes in global climate zones based on Köppen climate classification. WIREs Clim. Chang. 2021, 12, e701. [Google Scholar] [CrossRef]
  30. Felix, A.; Mendoza, E.; Chávez, V.; Silva, R.; Rivillas-Ospina, G. Wave and wind energy potential including extreme events: A case study of Mexico. J. Coast. Res. 2018, 85, 1336–1340. [Google Scholar] [CrossRef]
  31. Cruz González, G.; Alejandro, M.; Saldívar, D. El consumo de energía eléctrica en los hogares de México por nivel de ingresos, 2012. Tiempo Económico 2015, X, 43–56. [Google Scholar]
  32. Taufiqul, M.T.; Oo, A.M.; Shawkat Ali, A.B.M. Estimation of Energy Storage and Its Feasibility Analysis. In Energy Storage-Technologies and Applications; Zobaa, A.F., Ed.; IntechOpen: Rijeka, Croatia, 2013; pp. 41–78. [Google Scholar]
  33. INEGI. Anuario Estadístico y Geográfico de Quintana Roo 2017; Instituto Nacional de Estadística y Geografía México: Aguascalientes, Mexico, 2017; Available online: https://www.inegi.org.mx/contenido/productos/prod_serv/contenidos/espanol/bvinegi/productos/nueva_estruc/anuarios_2017/702825095130.pdf (accessed on 30 October 2021).
  34. Fernández Salgado, J.M. Compendio de Energía Solar: Fotovoltaica, Térmica y Termoeléctrica; Mundi-Prensa AMV Ediciones: Madrid, España, 2010. [Google Scholar]
  35. Khatib, T.; Ibrahim, I.A.; Mohamed, A. A review on sizing methodologies of photovoltaic array and storage battery in a standalone photovoltaic system. Energy Convers. Manag. 2016, 120, 430–448. [Google Scholar] [CrossRef]
  36. Zhou, Z.; Benbouzid, M.; Frédéric Charpentier, J.; Scuiller, F.; Tang, T. A review of energy storage technologies for marine current energy systems. Renew. Sustain. Energy Rev. 2013, 18, 390–400. [Google Scholar] [CrossRef] [Green Version]
  37. Shirasawa, K.; Tokunaga, K.; Iwashita, H.; Shintake, T. Experimental verification of a floating ocean-current turbine with a single rotor for use in Kuroshio currents. Renew. Energy 2016, 91, 189–195. [Google Scholar] [CrossRef]
  38. Maghami, M.R.; Hassani, R.; Gomes, C.; Hizam, H.; Othman, M.L.; Behmanesh, M. Hybrid energy management with respect to a hydrogen energy system and demand response. Int. J. Hydrogen Energy 2019, 45, 1499–1509. [Google Scholar] [CrossRef]
  39. Ibrahim, H.; Belmokhtar, K.; Ghandour, M. Investigation of usage of compressed air energy storage for power generation system improving—Application in a microgrid integrating wind energy. Energy Procedia 2015, 73, 305–316. [Google Scholar] [CrossRef] [Green Version]
  40. Hwang, C.-L.; Yoon, K. Multiple Attribute Decision Making: Methods and Applications, a State-of-the-Art Survey, 1st ed.; Springer: Berlin, Heidelberg, 1981; ISBN 9783540105589. [Google Scholar]
  41. Kacprzak, D. An extended TOPSIS method based on ordered fuzzy numbers for group decision making. Artif. Intell. Rev. 2020, 53, 2099–2129. [Google Scholar] [CrossRef] [Green Version]
  42. Ma, X.; Li, N.; Tao, X.; Xu, H.; Peng, F.; Che, Y.; Guo, S. The optimal selection of electrochemical energy storage using Bayesian BWM and TOPSIS method. In Proceedings of the 2019 6th International Conference on Information Science and Control Engineering (ICISCE), Shanghai, China, 20–22 December 2019; pp. 610–614. [Google Scholar] [CrossRef]
  43. Krohling, R.A.; Pacheco, A.G.C. A-TOPSIS—An approach based on TOPSIS for ranking evolutionary algorithms. Procedia Comput. Sci. 2015, 55, 308–317. [Google Scholar] [CrossRef] [Green Version]
  44. Garduño-Ruiz, E.P.; Silva, R.; Rodríguez-Cueto, Y.; García-Huante, A.; Olmedo-González, J.; Martínez, M.L.; Wojtarowski, A.; Martell-Dubois, R.; Cerdeira-Estrada, S. Criteria for optimal site selection for ocean thermal energy conversion (Otec) plants in Mexico. Energies 2021, 14, 2121. [Google Scholar] [CrossRef]
  45. Saaty, T.L. How to make a decision: The analytic hierarchy process. Eur. J. Oper. Res. 1990, 48, 9–26. [Google Scholar] [CrossRef]
Figure 2. Standard behavior of irradiance and irradiation in Cozumel: (a) daily solar-irradiance profile (W/m2); (b) daily irradiation average per month (kWh/m2).
Energies 15 00468 g002
Figure 3. Marine-current-speed profile in Cozumel: (a) daily standard marine-current-speed profile; (b) daily current speed average per month.
Energies 15 00468 g003
Figure 4. Daily standard-load profile of coastal house in Cozumel.
Energies 15 00468 g004
Figure 5. Solar potential in Cozumel: (a) solar-irradiance daily variations; (b) maximum, minimum, and average solar potential; (c) daily solar irradiation in different months of the year.
Energies 15 00468 g005
Figure 6. Marine-current potential in Cozumel; (a) marine-current-speed daily variations; (b) maximum, minimum, and average marine-current potential; (c) daily speed variation of the different days of the year.
Energies 15 00468 g006
Figure 7. Energy-balance analysis algorithm to evaluate the daily and seasonal energy-storage system.
Energies 15 00468 g007
Figure 8. Solar–MarineCurrent Energy Hybrid System diagram.
Energies 15 00468 g008
Figure 9. Classification of energy-storage technologies and alternatives for decision matrix.
Energies 15 00468 g009
Figure 10. (a) Generation–consumption profile of SMHES supplied by an installed capacity PVS of 2.1 kW or an MCS of 0.458 kW; (b) total generation–consumption profile of SMHES indicating the energy supplied by renewable resources, energy supplied by energy storage, and surplus of energy.
Energies 15 00468 g010
Figure 11. Generation–consumption profiles with different hybridization degrees: (a) 0 HD; (b) 0.2 HD; (c) 0.5 HD; (d) 0.8 HD; (e) 1 HD.
Energies 15 00468 g011aEnergies 15 00468 g011b
Figure 12. Number of cycles in a year in the different cases of hybridization and the comparison with daily energy storage.
Energies 15 00468 g012
Figure 13. PVS and MCS daily generation: (a) 0 HD and (b) 1 HD, with respect to the minimum seasonal generation corresponding to the base load (7.5 kWh/day).
Energies 15 00468 g013
Figure 14. PVS and MCS daily generation: (a) 0.2 HD, (b) 0.5 HD, and (c) 0.8 HD, with respect to the minimum seasonal generation corresponding to the base load (7.5 kWh/day).
Energies 15 00468 g014
Figure 15. Minimum generation availability at different HDs.
Energies 15 00468 g015
Figure 16. Seasonal energy storage at different HDs; additional energy storage per day with less generation than base load (7.5kWh/day).
Energies 15 00468 g016
Table 1. SMHES parameters in case study.
PVSMCS
ParameterValueParameterValue
PPVS2.1 kWPMCS0.458 kW
Gdm4.72 kWh/dayVmin0.65 m/s
Panel array7 modules (300 W)MCT3 turbines (153 W)
Panel area1.95 m2/moduleRotor area3.14 m2/turbine
Temperature25 °C
Seawater density1030 kg/m3
Table 2. Solar–Marine-Current Hybrid System (average results).
CaseHDPV SystemMC SystemRPESS (kWh/day)% Reduction RPESS **Average Cycles/Day (Charge–Discharge)
Power-Installed Capacity (kW)Energy (kWh/day)Power-Installed Capacity (kW)Energy
(kWh/day)
102.111.55005.39-1
20.21.689.240.095.653.1759%3.5
30.51.055.770.2312.41.7555%3
40.80.422.310.3622.61.0761%1.5
51000.4628.260.8579%1
6 *-2.111.550.4628.26--1
* In Case 6, PVS and MCS provide the maximum power, double the energy that the system requires, which is included for comparison purposes. ** % Reduction in RPESS with respect to Case 1, where there is the largest energy-storage system.
Table 3. Decision matrix evaluating the different alternatives and criteria.
Lifetime Years
(C1)
Cycle Life,
No. of Cycles
(C2)
Energy Efficiency
%
(C3)
Power Rating
MW
(C4)
Response Time
(C5)
Storage Duration
(C6)
Power Density
W/L
(C7)
Energy Density Wh/L
(C8)
Installed System Cost USD/kWh
(C9)
Maturity
(C10)
PHS
(A1)
5020,000803000minuteshours–months1.52100Mature
CAES
(A2)
3010,000651000minuteshours–months2650Commercialized
Small CAES
(A3)
2312008010secondshours–months26200Early commercialized
Pb Battery (A4)1515008540millisecondsminutes–days200100300Mature
Li-ion Battery (A5)15300090100millisecondsminutes–days30004001000Commercialized
Flywheel (A6)2020,0008520secondsseconds–minutes1500803000Early commercialized
Supercapacitors
(A7)
3050,000900.3millisecondsseconds–hours100,000301750Deve-loping
Fuel cell Hydrogen
(A8)
2010,00026100secondshours–months5006001000Develop-ing
Table 4. Weighting of the Multi-Criteria Decision Analysis.
CriteriaType
(Min/Max)
Weighting
REES
Weighting
PCEES
Weighting
RPCESS
Lifetime (years)max0.070.070.04
Cycle lifemax0.080.080.07
Energy efficiency (%)max0.100.090.09
Power rating (MW)min0.130.130.12
Response timemax0.360.180.21
Storage durationmax0.170.350.29
Power density (W/L)max0.030.030.03
Energy density (Wh/L)max0.030.030.05
Installed system cost (USD/kWh)min0.010.010.03
Maturitymax0.020.020.06
nmax = 11.41,
CI = 0.15, CR = 0.09
nmax = 11.41,
CI = 0.15, CR= 0.09
nmax = 10.91,
CI = 0.10, CR= 0.06
Note: nmax is an eigenvalue of the decision matrix; CI is the consistency index; and CR is the consistency ratio.
Table 5. Ranking of EES using the TOPSIS method.
ESSHierarchy
RESS
Hierarchy
PCESS
Hierarchy
RPCESS
PHS (A1)888
CAES (A2)766
Small CAES (A3)525
Pb Battery (A4)352
Li-ion Battery (A5)241
Flywheel (A6)677
Supercapacitors (A7)133
Hydrogen (A8)414
Publisher’s Note: MDPI stays neutral with regard to jurisdictional claims in published maps and institutional affiliations.

